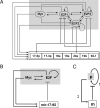
MicroRNA regulation of a cancer network: consequences of the feedback loops involving miR-17-92, E2F, and Myc
- PMID: 19066217
- PMCID: PMC2598727
- DOI: 10.1073/pnas.0811166106
MicroRNA regulation of a cancer network: consequences of the feedback loops involving miR-17-92, E2F, and Myc
Abstract
The transcription factors E2F and Myc participate in the control of cell proliferation and apoptosis, and can act as oncogenes or tumor suppressors depending on their levels of expression. Positive feedback loops in the regulation of these factors are predicted-and recently shown experimentally-to lead to bistability, which is a phenomenon characterized by the existence of low and high protein levels ("off" and "on" levels, respectively), with sharp transitions between levels being inducible by, for example, changes in growth factor concentrations. E2F and Myc are inhibited at the posttranscriptional step by members of a cluster of microRNAs (miRs) called miR-17-92. In return, E2F and Myc induce the transcription of miR-17-92, thus forming a negative feedback loop in the interaction network. The consequences of the coupling between the E2F/Myc positive feedback loops and the E2F/Myc/miR-17-92 negative feedback loop are analyzed using a mathematical model. The model predicts that miR-17-92 plays a critical role in regulating the position of the off-on switch in E2F/Myc protein levels, and in determining the on levels of these proteins. The model also predicts large-amplitude protein oscillations that coexist with the off steady state levels. Using the concept and model prediction of a "cancer zone," the oncogenic and tumor suppressor properties of miR-17-92 is demonstrated to parallel the same properties of E2F and Myc.
Conflict of interest statement
The authors declare no conflict of interest.
Figures


Similar articles
-
MicroRNA-mediated positive feedback loop and optimized bistable switch in a cancer network Involving miR-17-92.PLoS One. 2011;6(10):e26302. doi: 10.1371/journal.pone.0026302. Epub 2011 Oct 14. PLoS One. 2011. PMID: 22022595 Free PMC article.
-
Noise propagation in gene regulation networks involving interlinked positive and negative feedback loops.PLoS One. 2012;7(12):e51840. doi: 10.1371/journal.pone.0051840. Epub 2012 Dec 20. PLoS One. 2012. PMID: 23284787 Free PMC article.
-
mRNA and miRNA Expression Analyses of the MYC/E2F/miR-17-92 Network in the Most Common Pediatric Brain Tumors.Int J Mol Sci. 2021 Jan 7;22(2):543. doi: 10.3390/ijms22020543. Int J Mol Sci. 2021. PMID: 33430425 Free PMC article.
-
Network calisthenics: control of E2F dynamics in cell cycle entry.Cell Cycle. 2011 Sep 15;10(18):3086-94. doi: 10.4161/cc.10.18.17350. Epub 2011 Sep 15. Cell Cycle. 2011. PMID: 21900750 Free PMC article. Review.
-
Checks and balances: E2F-microRNA crosstalk in cancer control.Cell Cycle. 2010 Jul 1;9(13):2555-67. doi: 10.4161/cc.9.13.12061. Cell Cycle. 2010. PMID: 20581444 Review.
Cited by
-
Optimal control strategies of eradicating invisible glioblastoma cells after conventional surgery.J R Soc Interface. 2015 May 6;12(106):20141392. doi: 10.1098/rsif.2014.1392. J R Soc Interface. 2015. PMID: 25833239 Free PMC article.
-
Key nodes of a microRNA network associated with the integrated mesenchymal subtype of high-grade serous ovarian cancer.Chin J Cancer. 2015 Jan;34(1):28-40. doi: 10.5732/cjc.014.10284. Chin J Cancer. 2015. PMID: 25556616 Free PMC article. Review.
-
Noncoding RNAs in DNA repair and genome integrity.Antioxid Redox Signal. 2014 Feb 1;20(4):655-77. doi: 10.1089/ars.2013.5514. Epub 2013 Sep 18. Antioxid Redox Signal. 2014. PMID: 23879367 Free PMC article. Review.
-
Robustness and backbone motif of a cancer network regulated by miR-17-92 cluster during the G1/S transition.PLoS One. 2013;8(3):e57009. doi: 10.1371/journal.pone.0057009. Epub 2013 Mar 1. PLoS One. 2013. PMID: 23469179 Free PMC article.
-
MicroRNAs in cholangiociliopathies.Cell Cycle. 2009 May 1;8(9):1324-8. doi: 10.4161/cc.8.9.8253. Epub 2009 May 23. Cell Cycle. 2009. PMID: 19342876 Free PMC article. Review.
References
-
- Gartel AL, Kandel ES. miRNAs: Little known mediators of oncogenesis. Semin Cancer Biol. 2008;18:103–110. - PubMed
-
- Watanabe Y, Tomita M, Kanai A. Computational methods for microRNA target prediction. Methods Enzymol. 2007;427:65–86. - PubMed
-
- Mazière P, Enright AJ. Prediction of microRNA targets. Drug Discov Today. 2007;12:452–458. - PubMed
-
- Gusev Y. Computational methods for analysis of cellular functions and pathways collectively targeted by differentially expressed microRNA. Methods. 2008;44:61–72. - PubMed
Publication types
MeSH terms
Substances
Grants and funding
LinkOut - more resources
Full Text Sources
Other Literature Sources

