BH3-only protein Bim more critical than Puma in tyrosine kinase inhibitor-induced apoptosis of human leukemic cells and transduced hematopoietic progenitors carrying oncogenic FLT3
- PMID: 19064725
- PMCID: PMC3272395
- DOI: 10.1182/blood-2008-07-167023
BH3-only protein Bim more critical than Puma in tyrosine kinase inhibitor-induced apoptosis of human leukemic cells and transduced hematopoietic progenitors carrying oncogenic FLT3
Abstract
Constitutively activating internal tandem duplications (ITD) of FLT3 (FMS-like tyrosine kinase 3) are the most common mutations in acute myeloid leukemia (AML) and correlate with poor prognosis. Receptor tyrosine kinase inhibitors targeting FLT3 have developed as attractive treatment options. Because relapses occur after initial responses, identification of FLT3-ITD-mediated signaling events are important to facilitate novel therapeutic interventions. Here, we have determined the growth-inhibitory and proapoptotic mechanisms of 2 small molecule inhibitors of FLT3, AG1295 or PKC412, in hematopoietic progenitor cells, human leukemic cell lines, and primary AML cells expressing FLT3-ITD. Inactivation of the PI3-kinase pathway, but not of Ras-mitogen-activated protein (MAP) kinase signaling, was essential to elicit cytotoxic responses. Both compounds induced up-regulation of proapoptotic BH3-only proteins Bim and Puma, and subsequent cell death. However, only silencing of Bim, or its direct transcriptional activator FOXO3a, abrogated apoptosis efficiently. Similar findings were made in bone marrow cells from gene-targeted mice lacking Bim and/or Puma infected with FLT3-ITD and treated with inhibitor, where loss of Puma only provided transient protection from apoptosis, but loss of Bim preserved clonal survival upon FLT3-ITD inhibition.
Figures


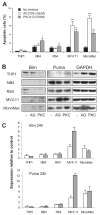
 ). The results are mean (± SD) from 2 experiments performed in triplicates and presented as relative expression compared with the control housekeeping gene GusB.
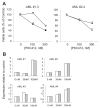
 ) mRNA from the same AML patients were measured by real-time PCR after 24 hours of treatment with 30 and 100 nM PKC412. Results are from triplicate reactions.

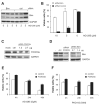
 ), or Puma (
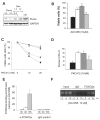
 ). Cell lysates were prepared after 24 hours for Western blot analysis of Puma (A). In separate experiments, cells were transfected with siRNA as indicated, and 4 hours after transfection, AG1295 at 10 μM was added. Twenty-four hours later, cells were analyzed for apoptosis by flow cytometry after staining with annexin V–FITC and PI (B). Data shown are mean (± SD) from 1 representative experiment performed in duplicate and repeated twice. **P < .01 (SD over control siRNA); ***P < .001 (SD over control siRNA). (C,D) Wild-type (■), bim-/- (□), bim-/- puma-/- (
 ), or puma-/-(
 ) bone marrow–derived Lin− progenitor cells infected with FLT3-ITD were FACS-sorted based on expression of EYFP. After treatment with 10 and 20 nM PKC412, the viability was assessed by flow cytometry after 72 hours in culture and compared with cells cultured without treatment (C). The bone marrow cells were also analyzed for colony formation in the absence of supportive cytokine but treated with 10 nM PKC412. Colony numbers were assessed after 7 days of culture (D). Data are mean (± SD) from 3 experiments. *P < .03 (SD compared with bone marrow–derived colonies from bim-/- mice). (E,F) ChIP-quantitative PCR analysis for FOXO3a binding to the Bim promotor. Sonicated DNA from FDC-P1/FLT3-ITD cells treated with AG1295 at 10 μM for 4 and 10 hours was immunoprecipitated with anti-FOXO3a or control rabbit IgG and amplified by quantitative PCR using primers specific for the Bim promotor. Relative expression of Bim was normalized to the input value and then compared with the corresponding untreated samples. Error bars represent SEM of triplicate reactions from 1 representative analysis of 2 separate experiments performed (E). PCRs were also visualized on 1.5% agarose gels stained with ethidium bromide (F).
Similar articles
-
The antitumor compound triazoloacridinone C-1305 inhibits FLT3 kinase activity and potentiates apoptosis in mutant FLT3-ITD leukemia cells.Acta Pharmacol Sin. 2015 Mar;36(3):385-99. doi: 10.1038/aps.2014.142. Epub 2015 Feb 2. Acta Pharmacol Sin. 2015. PMID: 25640477 Free PMC article.
-
PUMA and BIM are required for oncogene inactivation-induced apoptosis.Sci Signal. 2013 Mar 26;6(268):ra20. doi: 10.1126/scisignal.2003483. Sci Signal. 2013. PMID: 23532334 Free PMC article.
-
FLT3 receptors with internal tandem duplications promote cell viability and proliferation by signaling through Foxo proteins.Oncogene. 2004 Apr 22;23(19):3338-49. doi: 10.1038/sj.onc.1207456. Oncogene. 2004. PMID: 14981546
-
Importance of PTM of FLT3 in acute myeloid leukemia.Acta Biochim Biophys Sin (Shanghai). 2024 Jun 24;56(8):1199-1207. doi: 10.3724/abbs.2024112. Acta Biochim Biophys Sin (Shanghai). 2024. PMID: 38915288 Free PMC article. Review.
-
[Research Progress of FLT3 Mutation in Acute Myeloid Leukemia --Review].Zhongguo Shi Yan Xue Ye Xue Za Zhi. 2023 Jun;31(3):922-926. doi: 10.19746/j.cnki.issn.1009-2137.2023.03.046. Zhongguo Shi Yan Xue Ye Xue Za Zhi. 2023. PMID: 37356962 Review. Chinese.
Cited by
-
EGCG inhibits growth of human pancreatic tumors orthotopically implanted in Balb C nude mice through modulation of FKHRL1/FOXO3a and neuropilin.Mol Cell Biochem. 2013 Jan;372(1-2):83-94. doi: 10.1007/s11010-012-1448-y. Epub 2012 Sep 13. Mol Cell Biochem. 2013. PMID: 22971992 Free PMC article.
-
Bim and Mcl-1 exert key roles in regulating JAK2V617F cell survival.BMC Cancer. 2011 Jan 19;11:24. doi: 10.1186/1471-2407-11-24. BMC Cancer. 2011. PMID: 21247487 Free PMC article.
-
Voltage-Dependent Anion Channel 1(VDAC1) Participates the Apoptosis of the Mitochondrial Dysfunction in Desminopathy.PLoS One. 2016 Dec 12;11(12):e0167908. doi: 10.1371/journal.pone.0167908. eCollection 2016. PLoS One. 2016. PMID: 27941998 Free PMC article.
-
The effect of BIM deletion polymorphism on intrinsic resistance and clinical outcome of cancer patient with kinase inhibitor therapy.Sci Rep. 2015 Jun 15;5:11348. doi: 10.1038/srep11348. Sci Rep. 2015. PMID: 26076815 Free PMC article.
-
FLT3 tyrosine kinase inhibitors synergize with BCL-2 inhibition to eliminate FLT3/ITD acute leukemia cells through BIM activation.Signal Transduct Target Ther. 2021 May 24;6(1):186. doi: 10.1038/s41392-021-00578-4. Signal Transduct Target Ther. 2021. PMID: 34024909 Free PMC article.
References
-
- Kottaridis PD, Gale RE, Frew ME, et al. The presence of a FLT3 internal tandem duplication in patients with acute myeloid leukemia (AML) adds important prognostic information to cytogenetic risk group and response to the first cycle of chemotherapy: analysis of 854 patients from the United Kingdom Medical Research Council AML 10 and 12 trials. Blood. 2001;98:1752–1759. - PubMed
-
- Kiyoi H, Naoe T, Nakano Y, et al. Prognostic implication of FLT3 and N-RAS gene mutations in acute myeloid leukemia. Blood. 1999;93:3074–3080. - PubMed
-
- Stirewalt DL, Kopecky KJ, Meshinchi S, et al. FLT3, RAS, and TP53 mutations in elderly patients with acute myeloid leukemia. Blood. 2001;97:3589–3595. - PubMed
-
- Thiede C, Steudel C, Mohr B, et al. Analysis of FLT3-activating mutations in 979 patients with acute myelogenous leukemia: association with FAB subtypes and identification of subgroups with poor prognosis. Blood. 2002;99:4326–4335. - PubMed
-
- Mizuki M, Fenski R, Halfter H, et al. Flt3 mutations from patients with acute myeloid leukemia induce transformation of 32D cells mediated by the Ras and STAT5 pathways. Blood. 2000;96:3907–3914. - PubMed
Publication types
MeSH terms
Substances
Grants and funding
LinkOut - more resources
Full Text Sources
Medical
Molecular Biology Databases
Research Materials
Miscellaneous

