

Dynamic analyses of Drosophila gastrulation provide insights into collective cell migration
- PMID: 19056986
- PMCID: PMC2801059
- DOI: 10.1126/science.1167094
Dynamic analyses of Drosophila gastrulation provide insights into collective cell migration
Abstract
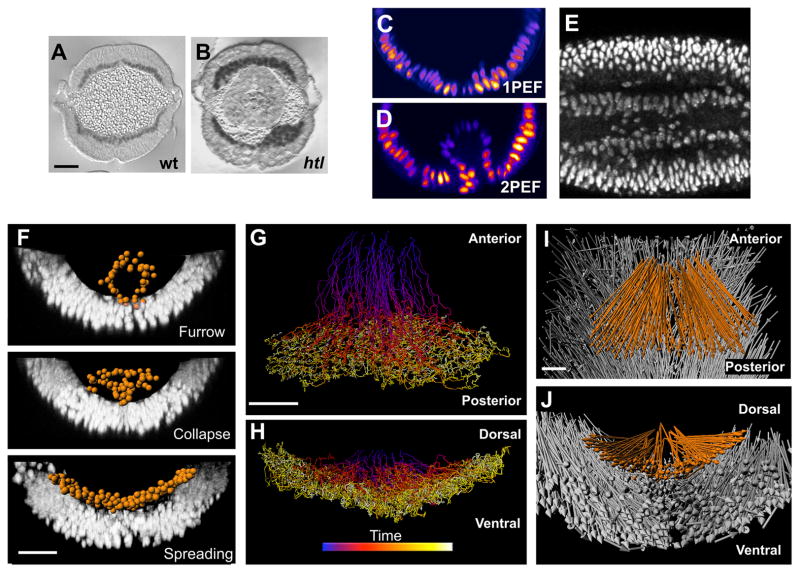
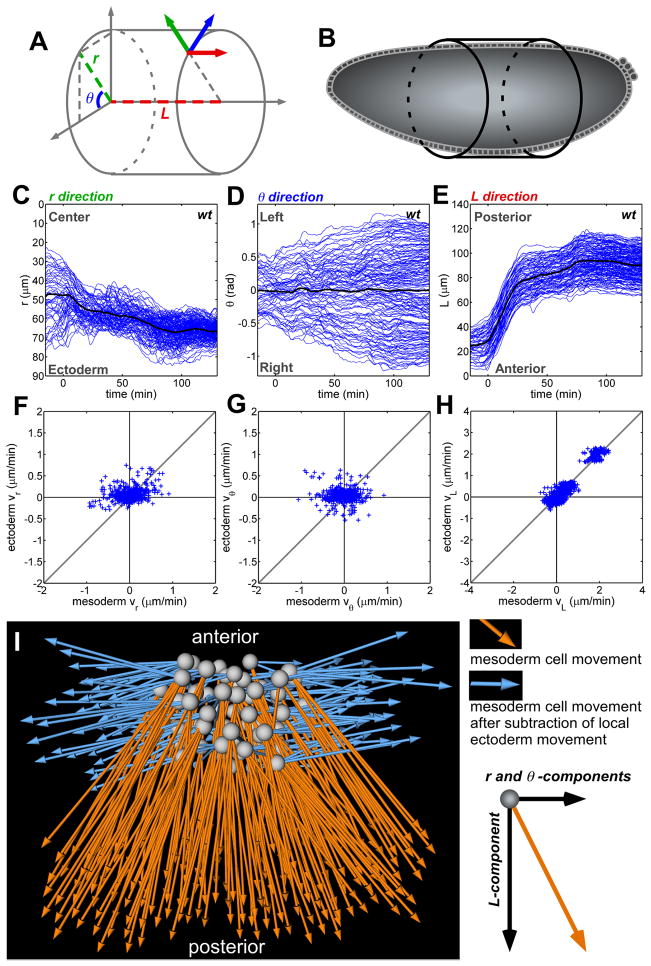
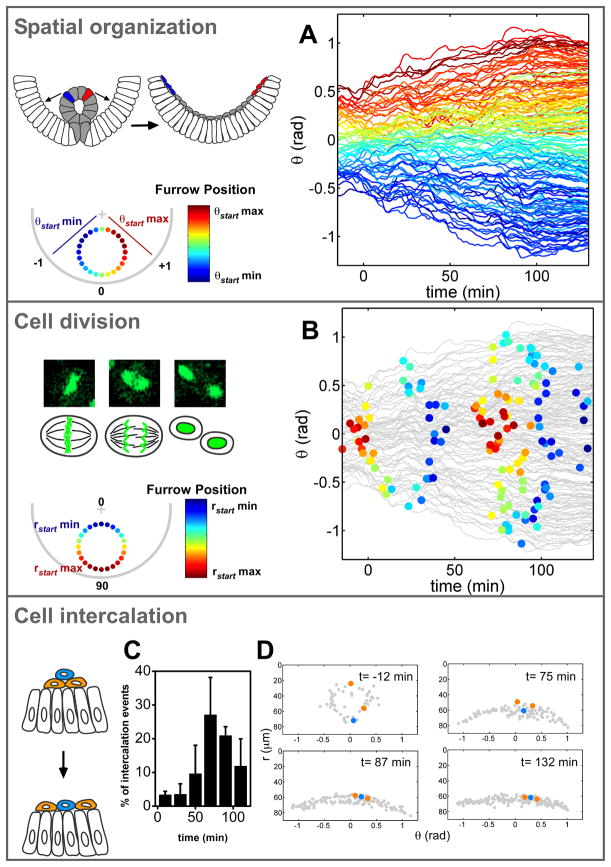
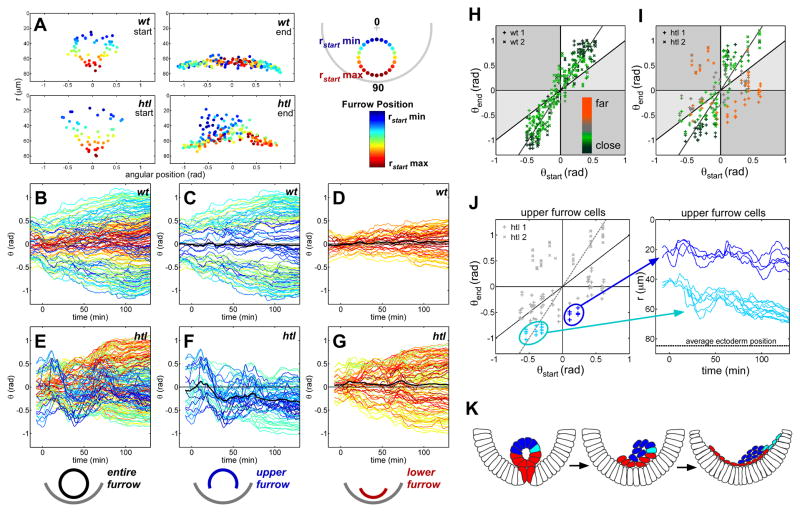
The concerted movement of cells from different germ layers contributes to morphogenesis during early embryonic development. Using an optimized imaging approach and quantitative methods, we analyzed the trajectories of hundreds of ectodermal cells and internalized mesodermal cells within Drosophila embryos over 2 hours during gastrulation. We found a high level of cellular organization, with mesoderm cell movements correlating with some but not all ectoderm movements. During migration, the mesoderm population underwent two ordered waves of cell division and synchronous cell intercalation, and cells at the leading edge stably maintained position. Fibroblast growth factor (FGF) signaling guides mesodermal cell migration; however, we found some directed dorsal migration in an FGF receptor mutant, which suggests that additional signals are involved. Thus, decomposing complex cellular movements can provide detailed insights into collective cell migration.
Figures
Similar articles
-
FGF signals guide migration of mesenchymal cells, control skeletal morphogenesis [corrected] and regulate gastrulation during sea urchin development.Development. 2008 Jan;135(2):353-65. doi: 10.1242/dev.014282. Epub 2007 Dec 12. Development. 2008. PMID: 18077587
-
Mesoderm migration in Drosophila is a multi-step process requiring FGF signaling and integrin activity.Development. 2010 Jul;137(13):2167-75. doi: 10.1242/dev.051573. Development. 2010. PMID: 20530544 Free PMC article.
-
FGF controls epithelial-mesenchymal transitions during gastrulation by regulating cell division and apicobasal polarity.Development. 2018 Oct 1;145(19):dev161927. doi: 10.1242/dev.161927. Development. 2018. PMID: 30190277 Free PMC article.
-
Regulation of gastrulation movements by emergent cell and tissue interactions.Curr Opin Cell Biol. 2017 Oct;48:33-39. doi: 10.1016/j.ceb.2017.04.006. Epub 2017 Jun 3. Curr Opin Cell Biol. 2017. PMID: 28586710 Free PMC article. Review.
-
Cellular and molecular mechanisms of convergence and extension in zebrafish.Curr Top Dev Biol. 2020;136:377-407. doi: 10.1016/bs.ctdb.2019.08.001. Epub 2019 Sep 3. Curr Top Dev Biol. 2020. PMID: 31959296 Free PMC article. Review.
Cited by
-
Single-cell transcriptomics illuminates regulatory steps driving anterior-posterior patterning of Drosophila embryonic mesoderm.Cell Rep. 2023 Oct 31;42(10):113289. doi: 10.1016/j.celrep.2023.113289. Epub 2023 Oct 19. Cell Rep. 2023. PMID: 37858470 Free PMC article.
-
Cell lineage tracing in the developing enteric nervous system: superstars revealed by experiment and simulation.J R Soc Interface. 2014 Feb 5;11(93):20130815. doi: 10.1098/rsif.2013.0815. Print 2014 Apr 6. J R Soc Interface. 2014. PMID: 24501272 Free PMC article. Review.
-
Fast, accurate reconstruction of cell lineages from large-scale fluorescence microscopy data.Nat Methods. 2014 Sep;11(9):951-8. doi: 10.1038/nmeth.3036. Epub 2014 Jul 20. Nat Methods. 2014. PMID: 25042785
-
Quantitative in vivo imaging of embryonic development: opportunities and challenges.Differentiation. 2012 Jul;84(1):149-62. doi: 10.1016/j.diff.2012.05.003. Epub 2012 Jun 12. Differentiation. 2012. PMID: 22695188 Free PMC article. Review.
-
Protocadherin-19 and N-cadherin interact to control cell movements during anterior neurulation.J Cell Biol. 2010 Nov 29;191(5):1029-41. doi: 10.1083/jcb.201007008. J Cell Biol. 2010. PMID: 21115806 Free PMC article.
References
-
- Rorth P. Trends Cell Biol. 2007;17:575. - PubMed
-
- Montell DJ. Curr Opin Genet Dev. 2006;16:374. - PubMed
-
- Stern CD. Gastrulation: From Cells to Embryo. Cold Spring HarborLaboratory Press; Cold Spring Harbor, NY: 2004.
-
- Lecaudey V, Gilmour D. Curr Opin Cell Biol. 2006;18:102. - PubMed
-
- Rohde LA, Heisenberg CP. Int Rev Cytol. 2007;261:159. - PubMed
Publication types
MeSH terms
Substances
Grants and funding
LinkOut - more resources
Full Text Sources
Other Literature Sources
Molecular Biology Databases
