West Nile virus-specific CD4 T cells exhibit direct antiviral cytokine secretion and cytotoxicity and are sufficient for antiviral protection
- PMID: 19050276
- PMCID: PMC3504655
- DOI: 10.4049/jimmunol.181.12.8568
West Nile virus-specific CD4 T cells exhibit direct antiviral cytokine secretion and cytotoxicity and are sufficient for antiviral protection
Abstract
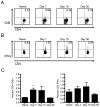
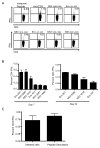
CD4 T cells have been shown to be necessary for the prevention of encephalitis during West Nile virus (WNV) infection. However, the mechanisms used by Ag-specific CD4 T cells to protect mice from WNV encephalitis remain incompletely understood. Contrary to the belief that CD4 T cells are protective because they merely maintain the CD8 T cell response and improve Ab production, in this study we provide evidence for the direct antiviral activity of CD4 T cells that functions to protect the host from WNV encephalitis. In adoptive transfers, naive CD4 T cells protected a significant number of lethally infected RAG(-/-) mice, demonstrating the protective effect of CD4 T cells independent of B cells and CD8 T cells. To shed light on the mechanism of this protection, we defined the peptide specificities of the CD4 T cells responding to WNV infection in C57BL/6 (H-2(b)) mice, and used these peptides to characterize the in vivo function of antiviral CD4 T cells. WNV-specific CD4 T cells produced IFN-gamma and IL-2, but also showed potential for in vivo and ex vivo cytotoxicity. Furthermore, peptide vaccination using CD4 epitopes conferred protection against lethal WNV infection in immunocompetent mice. These results demonstrate the role of direct effector function of Ag-specific CD4 T cells in preventing severe WNV disease.
Figures


Similar articles
-
Single-chain HLA-A2 MHC trimers that incorporate an immundominant peptide elicit protective T cell immunity against lethal West Nile virus infection.J Immunol. 2010 Apr 15;184(8):4423-30. doi: 10.4049/jimmunol.0903955. Epub 2010 Mar 8. J Immunol. 2010. PMID: 20212098 Free PMC article.
-
Repeated in vivo stimulation of T and B cell responses in old mice generates protective immunity against lethal West Nile virus encephalitis.J Immunol. 2011 Apr 1;186(7):3882-91. doi: 10.4049/jimmunol.1002799. Epub 2011 Feb 21. J Immunol. 2011. PMID: 21339368 Free PMC article.
-
Protective capacity and epitope specificity of CD8(+) T cells responding to lethal West Nile virus infection.Eur J Immunol. 2007 Jul;37(7):1855-63. doi: 10.1002/eji.200737196. Eur J Immunol. 2007. PMID: 17559175
-
Mapping and analysis of West Nile virus-specific monoclonal antibodies: prospects for vaccine development.Expert Rev Vaccines. 2007 Apr;6(2):183-91. doi: 10.1586/14760584.6.2.183. Expert Rev Vaccines. 2007. PMID: 17408368 Review.
-
The molecular basis of antibody protection against West Nile virus.Curr Top Microbiol Immunol. 2008;317:125-53. doi: 10.1007/978-3-540-72146-8_5. Curr Top Microbiol Immunol. 2008. PMID: 17990792 Review.
Cited by
-
Self-recognition drives the preferential accumulation of promiscuous CD4(+) T-cells in aged mice.Elife. 2015 Jul 14;4:e05949. doi: 10.7554/eLife.05949. Elife. 2015. PMID: 26173205 Free PMC article.
-
Variances in Antiviral Memory T-Cell Repertoire of CD45RA- and CD62L-Depleted Lymphocyte Products Reflect the Need of Individual T-Cell Selection Strategies to Reduce the Risk of GvHD while Preserving Antiviral Immunity in Adoptive T-Cell Therapy.Transfus Med Hemother. 2021 Sep 10;49(1):30-43. doi: 10.1159/000516284. eCollection 2022 Feb. Transfus Med Hemother. 2021. PMID: 35221866 Free PMC article.
-
IPS-1 is essential for the control of West Nile virus infection and immunity.PLoS Pathog. 2010 Feb 5;6(2):e1000757. doi: 10.1371/journal.ppat.1000757. PLoS Pathog. 2010. PMID: 20140199 Free PMC article.
-
Expanding roles for CD4⁺ T cells in immunity to viruses.Nat Rev Immunol. 2012 Jan 20;12(2):136-48. doi: 10.1038/nri3152. Nat Rev Immunol. 2012. PMID: 22266691 Free PMC article. Review.
-
Immunotherapy of human papilloma virus induced disease.Open Virol J. 2012;6:257-63. doi: 10.2174/1874357901206010257. Epub 2012 Dec 28. Open Virol J. 2012. PMID: 23341861 Free PMC article.
References
-
- Anderson JF, Andreadis TG, Vossbrinck CR, Tirrell S, Wakem EM, French RA, Garmendia AE, Van Kruiningen HJ. Isolation of West Nile virus from mosquitoes, crows, and a Cooper’s hawk in Connecticut. Science. 1999;286:2331–2333. - PubMed
-
- Lanciotti RS, Roehrig JT, Deubel V, Smith J, Parker M, Steele K, Crise B, Volpe KE, Crabtree MB, Scherret JH, Hall RA, MacKenzie JS, Cropp CB, Panigrahy B, Ostlund E, Schmitt B, Malkinson M, Banet C, Weissman J, Komar N, Savage HM, Stone W, McNamara T, Gubler DJ. Origin of the West Nile virus responsible for an outbreak of encephalitis in the northeastern United States. Science. 1999;286:2333–2337. - PubMed
-
- West nile virus activity--United States, January 1-November 7, 2006. Mmwr. 2006;55:1204–1205. - PubMed
-
- . West Nile Virus. Centers for Disease Control; 2003.
-
- CDC. West Nile virus Statistics, Surveillance, and Control. 2008.
Publication types
MeSH terms
Substances
Grants and funding
LinkOut - more resources
Full Text Sources
Other Literature Sources
Medical
Molecular Biology Databases
Research Materials

