. 2008 Dec 15;181(12):8460-77.
doi: 10.4049/jimmunol.181.12.8460.

Tat-induced FOXO3a is a key mediator of apoptosis in HIV-1-infected human CD4+ T lymphocytes

Affiliations

Tat-induced FOXO3a is a key mediator of apoptosis in HIV-1-infected human CD4+ T lymphocytes

Alicja Dabrowska et al. J Immunol. .

Abstract

The high mutation rate of HIV is linked to the generation of viruses expressing proteins with altered function whose impact on disease progression is unknown. We investigated how HIV-1 viruses lacking Env, Vpr, and Nef affect CD4(+) T cell survival. We found that in the absence of these proteins, HIV-1-infected CD4(+) primary T cells progress to the G(0) phase of the cell cycle and to cell death, indicating that viruses expressing inactive forms of these proteins can contribute to the CD4(+) T cell decline as the wild-type virus, suggesting that other HIV proteins are responsible for inducing apoptosis. Apoptosis in these cells is triggered by the alteration of the Egr1-PTEN-Akt (early growth response-1/phosphate and tensin homolog deleted on chromosome 10/Akt) and p53 pathways, which converge on the FOXO3a (Forkhead box transcription factor O class 3a) transcriptional activator. The FOXO3a target genes Fas ligand and TRAIL, involved in the extrinsic apoptotic pathway, and PUMA, Noxa, and Bim, which are part of the intrinsic apoptotic pathway, were also up-regulated, indicating that HIV infection leads to apoptosis by the engagement of multiple apoptotic pathways. RNAi-mediated knockdown of Egr1 and FOXO3a resulted in reduced apoptosis in HIV-infected HeLa and CD4(+) T cells, providing further evidence for their critical role in HIV-induced apoptosis and G(0) arrest. We tested the possibility that Tat is responsible for the T cell apoptosis observed with these mutant viruses. The induction of Egr1 and FOXO3a and its target genes was observed in Jurkat cells transduced by Tat alone. Tat-dependent activation of the Egr1-PTEN-FOXO3a pathway provides a mechanism for HIV-1-associated CD4(+) T cell death.


Figures
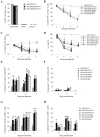
FIGURE 1
FIGURE 1
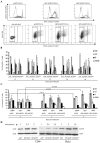
HIV-1 wild-type and mutants induce apoptosis in human primary CD4+ T cells at similar rates. A, Phenotype of sorted HIV-1-infected cells assessed by flow cytometry 2 days postinfection (day of sorting). The results are expressed as the means ± SE of three independent donors. B, Infected cell percentage measured by flow cytometric evaluation of GFP+ live cells. C, Total live cell count and (D) viability percentage of infected cultures monitored by trypan blue exclusion. EH, Apoptosis assessment over time in GFP+CD4+ T cells (EF) and in total CD4+ T lymphocytes (GH). Level of early apoptosis in CD4+ T cells infected with HIVΔ2GFP or HIVΔ3GFP virus is expressed as percentage of CD4+GFP+ (E) or CD4+ (G) T cells that are annexin V and 7AAD-negative relative to mock sample (eGFP). Late apoptosis is expressed as percentage of CD4+GFP+ (F) or CD4+ (H) T cells that are positive for both annexin V and 7AAD relative to mock sample (eGFP). The data represent the means ± SE of three experiments. * and #, p < 0.05 relate to increase or decrease, respectively, relative to control (eGFP).
FIGURE 2
FIGURE 2
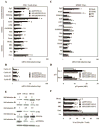
Cell cycle profiles of human CD4+ T cells infected with VSV-G-pseudotyped HIVΔ2GFP and HIVΔ3GFP (A). The results obtained with infected, sorted cells from three independent donors are reported in B and C. The results are expressed as the means ± SE of three independent experiments. *, p < 0.05 relative to eGFP control. D, Expression of p130 and phosphorylated p130 proteins measured by Western blot in infected and sorted CD4+GFP+ T cells or HeLa cells. Results are expressed as fold increase relative to eGFP control.
FIGURE 3
FIGURE 3
Cell cycle profiles of apoptotic human CD4+ T cells infected with VSV-G-pseudotyped HIVΔ2GFP and HIVΔ3GFP and sorted for GFP positivity. A, Percentage of annexin VGFP+ (left panel), annexin V+GFP+ (middle panel), and annexin V+GFP (right panel) cells. B, Flow cytometric analysis of cell cycle profiles in the cell populations reported in A determined by staining with an Ab against Ki-67 and 7AAD. C, Production of p24 in human CD4+ T cells infected with HIVΔ2GFP or HIVΔ3GFP. Production of HIV-1 p24 was measured in supernatants from infected, sorted cultures on days 2, 3, and 4 postinfection using a p24 ELISA. The results are expressed as the means ± SE of three independent donors. *, p < 0.05 related to decrease or increase.
FIGURE 4
FIGURE 4
Vpr-independent gene modulation in HIV-1-infected cells. A, Percentage CD4+GFP+ T cells after infection with HIVΔ2GFP or HIVΔ3GFP and sorting using GFP as a marker. B, Detection of Tat expression by quantitative real-time RT-PCR in HIV-1-infected human CD4+ T cells. Cycle threshold (Ct) values are given. C, Venn diagrams illustrating the number of genes modulated in different culture conditions. D, Vpr-independent gene modulation in HIV-1-infected CD4+ T cells. Profiles of up-regulated (red) or down-regulated (green) genes in human CD4+ T cells infected with HIVΔ2GFP or HIVΔ3GFP. The color scale is shown below the panels.
FIGURE 5
FIGURE 5
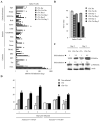
Expression analysis of selected genes modulated by HIV-1 in CD4+ T cells and in total PBMC. mRNA up-regulation of apoptosis-related genes (A) and mRNA down-regulation of selected genes involved in cell cycle regulation (B) were monitored by real-time PCR using RNAs from VSV-G-pseudotyped HIVΔ2GFP or HIVΔ3GFP infected, sorted human CD4+ T lymphocytes. Results are normalized to GAPDH and are expressed as fold induction (A) or fold reduction (B) relative to eGFP control. C, Same as A, but in this case the analysis is conducted in human PBMC infected with wild-type HIV-1 viruses with different tropism. The data represent the means ±SE of three independent experiments. *, p < 0.05 related to induction in expression and #, p < 0.05 related to reduction in expression. D, p53 protein expression was monitored on days 2 and 4 postinfection by intracellular staining. The data are obtained and quantitated with flow cytometric analysis and expressed as MFI. E, Protein accumulation levels for PTEN, Akt, phosphorylated Akt (Ser473), FOXO3a, and phosphorylated FOXO3a (Ser318) were measured on day 3 postinfection by Western blot and quantitated using Kodak image scan. Results are normalized to β-actin and are expressed as fold induction or fold reduction relative to eGFP control. F, TRAIL and TRAIL death receptors (DR4 and DR5), as well as Fas and FasL protein expression, were measured 24 h after sorting by surface or intracellular staining and analyzed by flow cytometry. Mean percentage ± SE of cells expressing each particular protein is reported for CD4+GFP+ T cells. The data represent the means ± SE of three independent experiments. *, p < 0.05 related to induction in expression and #, p < 0.05 related to reduction in expression.
FIGURE 6
FIGURE 6
siRNA-mediated knockdown of FOXO3a reduces HIV-1-induced apoptosis. A, Up-regulation of FOXO3a mRNA in human PBMC infected with wild-type HIV-1-Bal 7 days after infection and in HeLa, but not in H9, cells infected with VSV-G-pseudotyped HIVΔ2GFP and HIVΔ3GFP (2 days postinfection) monitored by real-time PCR. Results are normalized to GAPDH and are expressed as fold induction relative to mock or eGFP control. B, mRNA knockdown of FOXO3a and selected target genes of FOXO3a (Bcl6, GADD45a, PTEN, and TRAIL) by real-time PCR in HeLa cells transfected with nonspecific (ns) siRNA or siRNA targeting FOXO3a. Results are normalized to GAPDH and are expressed as fold reduction relative to cells treated with control nonspecific siRNA. Western blot analysis of cell lysates obtained from infected and noninfected cells treated with FOXO3a RNAi and nsRNAi (C), and level of apoptosis (D) in the same cells 48 h following siRNA transduction are shown. The data are expressed as the means ± SE of three independent experiments. #, p < 0.05 with regard to reduction in apoptosis in HIV-1-infected cells treated with siRNA against FOXO3a relative to HIV-1-infected cells treated with nonspecific siRNA.
FIGURE 7
FIGURE 7
Effects of siRNA-mediated knockdown of FOXO3a and blocking of extrinsic apoptotic pathways in HIV-infected human CD4+ T lymphocytes. A, mRNA expression of Egr1, FOXO3a, and PTEN by real-time PCR in CD4+ T cells electroporated with nonspecific (ns) siRNA or siRNA targeting Egr1 or FOXO3a. Results are normalized to GAPDH and are expressed as fold reduction relative to cells treated with control ns siRNA. B, Protein expression analysis of Egr1, PTEN, p-Akt, and FOXO3a by immunofluorescent staining in CD4+ T cells treated with siRNA targeting Egr1 or FOXO3a and infected with eGFP or HIV-1 pseudotyped with HXB2 envelope on day 2 postinfection. Results are expressed as fold MFI relative to control (eGFP-infected cells treated with nonspecific siRNA). # and *, p < 0.05 decrease or increase, respectively, in mRNA or protein level in cells treated with siRNA against Egr1 or FOXO3a relative to cells treated with nonspecific siRNA. MFI values found in cells of the two donors were used to derive the results reported in B were the following: Egr1 MFI (ns siRNA/eGFP: 10.1, 9.21; ns siRNA/HIVΔ2GFP: 27.5, 22.1; Egr1 siRNA/HIVΔ2GFP: 12.3, 15.2); FOXO3a MFI (ns siRNA/eGFP: 15.5, 15.7; ns siRNA/HIVΔ2GFP: 35.2, 32.1; FOXO3a siRNA/HIVΔ2GFP: 17.5, 19.2; Egr1 siRNA/HIVΔ2GFP: 13.5, 17.9); p-Akt MFI (ns siRNA/eGFP: 57.2, 45.0; ns siRNA/HIVΔ2GFP: 40.4, 34.1; Egr1 siRNA/HIVΔ2GFP: 56.3, 48.0; FOXO3a siRNA/HIVΔ2GFP: 65.1, 45.2); PTEN MFI (ns siRNA/eGFP: 28.6, 29.1; ns siRNA/HIVΔ2GFP: 52.0, 47.5; Egr1 siRNA/HIVΔ2GFP: 31.0, 35.2; FOXO3a siRNA/HIVΔ2GFP: 29.0, 31.7). C, p130 expression by immunofluorescent staining in CD4+ T cells treated with siRNA targeting FOXO3a and infected with eGFP or HIV-1 pseudotyped with HXB2 envelope. The first two panels show the flow cytometric analysis of p130 expression; the third panel reports the results as fold MFI relative to control (eGFP-infected cells treated with nonspecific siRNA). D, Level of apoptosis 48 h after HIV-1 infection in CD4+ T cells transduced with siRNA targeting Egr1 and FOXO3a and/or treated with mAbs blocking extrinsic apoptotic pathway. The data are expressed as the means ± SE of two independent experiments. #, p < 0.05 related to reduction in apoptosis in HIV-1-infected cells treated with siRNA against Egr1 or FOXO3a relative to HIV-1-infected cells treated with nonspecific siRNA.
FIGURE 8
FIGURE 8
ATF3 and ATM regulate expression of cyclin A and cyclin E in HIV-1-infected human primary CD4+ T lymphocytes. A, mRNA knockdown of ATF3 and ATM by real-time PCR in primary CD4+ T cells electroporated with nonspecific (ns) siRNA or siRNA targeting ATF3 or ATM. Results are normalized to GAPDH and are expressed as fold reduction relative to cells treated with control ns siRNA. B, Protein levels of ATF3 and ATM by flow cytometry in CD4+ T cells treated with siRNA targeting ATF3 or ATM and infected with eGFP or HIVΔ2GFP/HXB2 on day 2 postinfection. #, p < 0.05 related to reduction in mRNA or protein level in cells treated with siRNA against ATF3 or ATM relative to cells treated with ns siRNA. MFI values found in cells of the two donors and used to derive the results reported in B were the following: ATF3 MFI (ns siRNA/eGFP: 12.7, 15.2; ns siRNA/HIVΔ2GFP: 39.0, 33.1; ATF3 siRNA/HIVΔ2GFP: 19.5, 14.9; ATM siRNA/HIVΔ2GFP: 38.3, 32.5); ATM MFI (ns siRNA/eGFP: 4.3, 5.8; ns siRNA/HIVΔ2GFP: 15.0, 13.2; ATM siRNA/HIVΔ2GFP: 8.6, 9.9; ATF3 siRNA/HIVΔ2GFP: 11.7, 14.2). C, Flow cytometric analysis of cyclin A and cyclin E protein levels 2 days after eGFP or HIVΔ2GFP/HXB2 infection in CD4+ T cells from two independent donors transduced with ns siRNA or siRNA targeting ATF3 and ATM.
FIGURE 9
FIGURE 9
HIV-1 Tat-mediated up-regulation of Egr1-PTEN-FOXO3a and its target genes. A, Jurkat T cells were infected with adenoviruses expressing the tTA or tTA plus the SF2 Tat protein. mRNA levels of FOXO3a and its target genes were monitored by real-time PCR. Results are normalized to GAPDH and are expressed as fold induction relative to control (tTA only). B, Detection of Tat expression by quantitative real-time RT-PCR in Tat-infected Jurkat T cells. Ct values are given. The data represent the means ± SE of two independent experiments. *, p < 0.05 related to induction in expression. C, Protein levels of FOXO3a and phosphorylated FOXO3a (Ser318) by Western blot and quantitated by Kodak image scan. Results are normalized to β-actin and are expressed as fold induction or fold reduction relative to the tTA control. D, Apoptosis in Tat-expressing Jurkat T cells. Levels of early and late apoptosis are expressed as percentage of Jurkat T cells that stain for annexin V only (7AAD) or annexin V and 7AAD, respectively. The data represent the means ± SE of two experiments. *, p < 0.05 related to increase relative to control (tTA).
FIGURE 10
FIGURE 10
Schematic representation of the regulation of FOXO3a transcription factor and its target genes.

Similar articles

Cited by

References

    1. Lackner AA, Veazey RS. Current concepts in AIDS pathogenesis: insights from the SIV/macaque model. Annu Rev Med. 2007;58:461–476. - PubMed
    1. Weiss RA. HIV and AIDS: looking ahead. Nat Med. 2003;9:887–891. - PMC - PubMed
    1. Cotton MF, Ikle DN, Rapaport EL, Marschner S, Tseng PO, Kurrle R, Finkel TH. Apoptosis of CD4+ and CD8+ T cells isolated immediately ex vivo correlates with disease severity in human immunodeficiency virus type 1 infection. Pediatr Res. 1997;42:656–664. - PubMed
    1. Gougeon ML. Apoptosis as an HIV strategy to escape immune attack. Nat Rev Immunol. 2003;3:392–404. - PubMed
    1. Li CJ, Friedman DJ, Wang C, Metelev V, Pardee AB. Induction of apoptosis in uninfected lymphocytes by HIV-1 Tat protein. Science. 1995;268:429–431. - PubMed

Publication types

MeSH terms

Substances