Circuits generating corticomuscular coherence investigated using a biophysically based computational model. I. Descending systems
- PMID: 19019981
- PMCID: PMC2637020
- DOI: 10.1152/jn.90362.2008
Circuits generating corticomuscular coherence investigated using a biophysically based computational model. I. Descending systems
Abstract
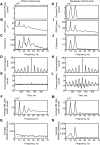
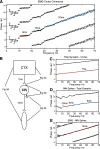
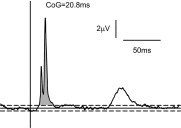
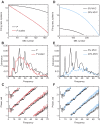
Recordings of motor cortical activity typically show oscillations around 10 and 20 Hz; only those at 20 Hz are coherent with electromyograms (EMGs) of contralateral muscles. Experimental measurements of the phase difference between approximately 20-Hz oscillations in cortex and muscle are often difficult to reconcile with the known corticomuscular conduction delays. We investigated the generation of corticomuscular coherence further using a biophysically based computational model, which included a pool of motoneurons connected to motor units that generated EMGs. Delays estimated from the coherence phase-frequency relationship were sensitive to the width of the motor unit action potentials. In addition, the nonlinear properties of the motoneurons could produce complex, oscillatory phase-frequency relationships. This was due to the interaction of cortical inputs to the motoneuron pool with the intrinsic rhythmicity of the motoneurons; the response appeared more linear if the firing rate of motoneurons varied widely across the pool, such as during a strong contraction. The model was able to reproduce the smaller than expected delays between cortex and muscles seen in experiments. However, the model could not reproduce the constant phase over a frequency band sometimes seen in experiments, nor the lack of around 10-Hz coherence. Simple propagation of oscillations from cortex to muscle thus cannot completely explain the observed corticomuscular coherence.
Figures


Similar articles
-
Only the Fastest Corticospinal Fibers Contribute to β Corticomuscular Coherence.J Neurosci. 2021 Jun 2;41(22):4867-4879. doi: 10.1523/JNEUROSCI.2908-20.2021. Epub 2021 Apr 23. J Neurosci. 2021. PMID: 33893222 Free PMC article.
-
Manipulation of peripheral neural feedback loops alters human corticomuscular coherence.J Physiol. 2005 Jul 15;566(Pt 2):625-39. doi: 10.1113/jphysiol.2005.089607. Epub 2005 May 26. J Physiol. 2005. PMID: 15919711 Free PMC article. Clinical Trial.
-
Renshaw cell recurrent inhibition improves physiological tremor by reducing corticomuscular coupling at 10 Hz.J Neurosci. 2009 May 20;29(20):6616-24. doi: 10.1523/JNEUROSCI.0272-09.2009. J Neurosci. 2009. PMID: 19458232 Free PMC article.
-
Rhythmical corticomotor communication.Neuroreport. 1999 Feb 5;10(2):R1-10. Neuroreport. 1999. PMID: 10203308 Review.
-
Motor unit.Compr Physiol. 2012 Oct;2(4):2629-82. doi: 10.1002/cphy.c100087. Compr Physiol. 2012. PMID: 23720261 Review.
Cited by
-
Force variability is mostly not motor noise: Theoretical implications for motor control.PLoS Comput Biol. 2021 Mar 8;17(3):e1008707. doi: 10.1371/journal.pcbi.1008707. eCollection 2021 Mar. PLoS Comput Biol. 2021. PMID: 33684099 Free PMC article.
-
An action potential-driven model of soleus muscle activation dynamics for locomotor-like movements.J Neural Eng. 2015 Aug;12(4):046025. doi: 10.1088/1741-2560/12/4/046025. Epub 2015 Jun 18. J Neural Eng. 2015. PMID: 26087477 Free PMC article.
-
DCM for complex-valued data: cross-spectra, coherence and phase-delays.Neuroimage. 2012 Jan 2;59(1):439-55. doi: 10.1016/j.neuroimage.2011.07.048. Epub 2011 Jul 28. Neuroimage. 2012. PMID: 21820062 Free PMC article.
-
Only the Fastest Corticospinal Fibers Contribute to β Corticomuscular Coherence.J Neurosci. 2021 Jun 2;41(22):4867-4879. doi: 10.1523/JNEUROSCI.2908-20.2021. Epub 2021 Apr 23. J Neurosci. 2021. PMID: 33893222 Free PMC article.
-
Models of passive and active dendrite motoneuron pools and their differences in muscle force control.J Comput Neurosci. 2012 Dec;33(3):515-31. doi: 10.1007/s10827-012-0398-4. Epub 2012 May 6. J Comput Neurosci. 2012. PMID: 22562305
References
-
- Asanuma H, Zarzecki P, Jankowska E, Hongo T, Marcus S. Projection of individual pyramidal tract neurons to lumbar motor nuclei of the monkey. Exp Brain Res 34: 73–89, 1979. - PubMed
-
- Baker SN, Chiu M, Fetz EE. Afferent encoding of central oscillations in the monkey arm. J Neurophysiol 95: 3904–3910, 2006. - PubMed
-
- Baker SN, Lemon RN. A computer simulation study of the production of post-spike facilitation in spike triggered averages of rectified EMG. J Neurophysiol 80: 1391–1406, 1998. - PubMed
Publication types
MeSH terms
Grants and funding
LinkOut - more resources
Full Text Sources

