Programmed upregulation of adipogenic transcription factors in intrauterine growth-restricted offspring
- PMID: 19017816
- PMCID: PMC3444244
- DOI: 10.1177/1933719108318597
Programmed upregulation of adipogenic transcription factors in intrauterine growth-restricted offspring
Abstract
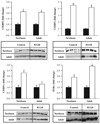
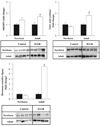
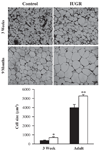
As enhanced adipogenesis contributes to programmed obesity, adipogenic and lipogenic signaling pathways in intrauterine growth restricted (IUGR) offspring were examined. From 10 days to term gestation, rats received ad libitum food (control) or were 50% food-restricted (IUGR). Pups were nursed and weaned to ad libitum diet. mRNA and protein levels of adipogenic transcription factors and lipid enzymes (1 day and 9 month) and adipocyte cell size (3 weeks and 9 months) were determined. One day-old IUGR males showed upregulation of peroxisome proliferator-activated receptor (PPAR gamma(2)), including upstream factors regulating PPAR gamma, and RXR alpha, with which PPAR gamma heterodimerizes. Intracellular lipolytic enzyme (hormone-sensitive lipase) was downregulated. Nine-month-old IUGR males showed upregulation of adipogenic and lipogenic (SREBP1c) transcription factors with upregulation of enzymes facilitating fatty acid uptake (lipoprotein lipase) and synthesis (fatty acid synthase), leading to hypertrophic adipocytes. Paradoxical upregulation of adipogenesis signaling cascade prior to the development of obesity in IUGR males suggests early changes in signaling mechanisms.
Figures


Similar articles
-
Maternal food restriction-induced intrauterine growth restriction in a rat model leads to sex-specific adipogenic programming.FASEB J. 2020 Dec;34(12):16073-16085. doi: 10.1096/fj.202000985RR. Epub 2020 Oct 13. FASEB J. 2020. PMID: 33047380 Free PMC article.
-
Down-regulation of transcription factor peroxisome proliferator-activated receptor in programmed hepatic lipid dysregulation and inflammation in intrauterine growth-restricted offspring.Am J Obstet Gynecol. 2008 Sep;199(3):271.e1-5. doi: 10.1016/j.ajog.2008.05.022. Epub 2008 Jul 29. Am J Obstet Gynecol. 2008. PMID: 18667178 Free PMC article.
-
Bone marrow mesenchymal stem cells of the intrauterine growth-restricted rat offspring exhibit enhanced adipogenic phenotype.Int J Obes (Lond). 2016 Nov;40(11):1768-1775. doi: 10.1038/ijo.2016.157. Epub 2016 Sep 7. Int J Obes (Lond). 2016. PMID: 27599633 Free PMC article.
-
Fetal programming of adipose tissue: effects of intrauterine growth restriction and maternal obesity/high-fat diet.Semin Reprod Med. 2011 May;29(3):237-45. doi: 10.1055/s-0031-1275517. Epub 2011 Jun 27. Semin Reprod Med. 2011. PMID: 21710399 Free PMC article. Review.
-
In utero programming of later adiposity: the role of fetal growth restriction.J Pregnancy. 2012;2012:134758. doi: 10.1155/2012/134758. Epub 2012 Nov 1. J Pregnancy. 2012. PMID: 23251802 Free PMC article. Review.
Cited by
-
Developmental origins of obesity: programmed adipogenesis.Curr Diab Rep. 2013 Feb;13(1):27-33. doi: 10.1007/s11892-012-0344-x. Curr Diab Rep. 2013. PMID: 23188593 Free PMC article. Review.
-
Maternal food restriction-induced intrauterine growth restriction in a rat model leads to sex-specific adipogenic programming.FASEB J. 2020 Dec;34(12):16073-16085. doi: 10.1096/fj.202000985RR. Epub 2020 Oct 13. FASEB J. 2020. PMID: 33047380 Free PMC article.
-
Early-life influences on obesity: from preconception to adolescence.Ann N Y Acad Sci. 2015 Jul;1347(1):1-28. doi: 10.1111/nyas.12778. Epub 2015 Jun 2. Ann N Y Acad Sci. 2015. PMID: 26037603 Free PMC article.
-
Mechanism of programmed obesity in intrauterine fetal growth restricted offspring: paradoxically enhanced appetite stimulation in fed and fasting states.Reprod Sci. 2012 Apr;19(4):423-30. doi: 10.1177/1933719111424448. Epub 2012 Feb 16. Reprod Sci. 2012. PMID: 22344733 Free PMC article.
-
Maternal high-fat diet programs rat offspring hypertension and activates the adipose renin-angiotensin system.Am J Obstet Gynecol. 2013 Sep;209(3):262.e1-8. doi: 10.1016/j.ajog.2013.05.023. Epub 2013 Jun 4. Am J Obstet Gynecol. 2013. PMID: 23743273 Free PMC article.
References
-
- Ogden CL, Yanovski SZ, Carroll MD, Flegal KM. The epidemiology of obesity. Gastroenterology. 2007;132:2087–2102. - PubMed
-
- Plagemann A, Harder T. The changing face and implications of childhood obesity. N Engl J Med. 2004;350:2414–2416. - PubMed
-
- Reilly MP, Rader DJ. The metabolic syndrome: more than the sum of its parts? Circulation. 2003;108:1546–1551. - PubMed
-
- Spiegelman BM, Flier JS. Adipogenesis and obesity: rounding out the big picture. Cell. 1996;87:377–389. - PubMed
-
- Ailhaud G, Grimaldi P, Negrel R. Cellular and molecular aspects of adipose tissue development. Annu Rev Nutr. 1992;12:207–233. - PubMed
Publication types
MeSH terms
Substances
Grants and funding
LinkOut - more resources
Full Text Sources
Research Materials

