. 2008 Dec;38(12):3411-25.
doi: 10.1002/eji.200838432.

Resident enteric microbiota and CD8+ T cells shape the abundance of marginal zone B cells

Affiliations

Resident enteric microbiota and CD8+ T cells shape the abundance of marginal zone B cells

Bo Wei et al. Eur J Immunol. 2008 Dec.

Abstract

Since enteric microbial composition is a distinctive and stable individual trait, microbial heterogeneity may confer lifelong, non-genetic differences between individuals. Here we report that C57BL/6 mice bearing restricted flora microbiota, a distinct but diverse resident enteric microbial community, are numerically and functionally deficient in marginal zone (MZ) B cells. Surprisingly, MZ B-cell levels are minimally affected by germ-free conditions or null mutations of various TLR signaling molecules. In contrast, MZ B-cell depletion is exquisitely dependent on cytolytic CD8(+) T cells, and includes targeting of a cross-reactive microbial/endogenous MHC class 1B antigen. Thus, members of certain enteric microbial communities link with CD8(+) T cells as a previously unappreciated mechanism that shapes innate immunity dependent on innate-like B cells.


Figures

Figure 1
Figure 1. Mice bearing distinct resident microbiota (RF mice) exhibit a severe reduction in MZ and B-1a B cells
(A) CD21/HSA(CD24) and (B) CD21/CD23 profiles of splenic CD19+ B cells from C57BL6 mice maintained in SPF versus RF conditions. The relative percentages of transitional 1 (T1), transitional 2 marginal zone precursor (T2-MZP) + marginal zone (MZ) (T2-MZP/MZ), follicular mature (FM), and marginal zone (MZ) are indicated. (C) CD21/CD23 profiles, gated on the T2-MZP/MZ (CD21hiHSAhi) population in (A) to distinguish (CD23hi) MZP from (CD23lo) MZ cells. (D) Percentage and (E) absolute numbers of T1, T2-MZP, MZ, and FM splenic B cell populations, with averages from five age-matched pairs. The relative percentage of MZP and MZ B cells were derived by multiplying the CD23hi or CD23lo fractions in (C) with the T2-MZP/MZ fractions in (A). (F) Comparison of spleens from age and gender-matched SPF and RF mice. (G) Immunofluorescence staining of splenic tissue sections with IgD (green), IgM (red) and MOMA-1 (blue) against marginal metallophilic macrophages. The arrows indicate marginal zone B cells, based on IgMhigh staining (red) and localization outside the MOMA+ layer (blue). Arrowheads highlight B cells in follicular areas, with IgD and IgM double expression confirmed by yellow staining. (H) Peritoneal cells (PECs) were gated on B220, and the staining contours for CD11b (Mac1) and CD5 are shown for SPF and RF mice. Minimal B-2 B cells (B220-gated, CD11bCD5) were detectable in this compartment. (I) Percentage and (J) absolute numbers of B-1 subsets in SPF (solid circles) and RF (open circles) animals. Representative results of 3 or more similar experiments.
Figure 2
Figure 2. RF mice exhibit defective B lineage dependent immune responses
Proliferation of CD43-depleted splenic B cells in response to (A) anti-CD40 Abs, and (B) LPS. (C) IL-10 production of splenic B cells in response to LPS. (D) Anti-TNP IgM and (E) anti-TNP IgG3 production in serum of mice challenged with the T-independent antigen, TNP-Ficoll. (F) Anti-TNP IgG1 production upon challenge with the T-dependent antigen, TNP-KLH. All the serum samples were diluted at 1:10 and then applied to ELISA assay for detection of antibody responses. The results are representative data from three similar experiments.
Figure 3
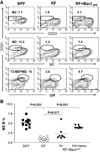
Figure 3. Microbiota in RF mice plays a role in the formation of MZ B cells
RF neonates were treated beginning at post-natal day 0 (P0) with lumenal bacteria from SPF mice (see Methods). The mice were examined for MZ B cell development at age of about 8 weeks old. (A) Phenotypes of splenic CD19+ B-cells; % MZ B cells in CD19+ gate are indicated. (B) Tabulation of % MZ B cells; each symbol represents data from an individual mouse. SPF: specific pathogen free mice; RF: restricted microbiota mice; RF+BactSPF P0: RF pups exposed to SPF cecal bacteria at post-natal day 0 (P0). RF+BactSPF P0+Vanco: Offspring derived from RF parental mice that were treated with vancomycin under SPF condition. These pups were exposed to SPF environment during and immediately after birth. P values by student t test for comparisons of SPF mice to RF and bacteria-treated RF mice. Data was obtained from 3 or more independent experiments.
Figure 4
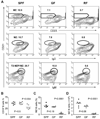
Figure 4. Profound deficiency of MZ B cells in RF mice but not in germ-free mice
(A) Splenic lymphocytes were isolated from age and gender-matched SPF, germ-free (GF) and RF mice, and stained to delineate MZ B cells (CD19, CD21, IgM and IgD). The percentages of cell populations with MZ B cell phenotypes are indicated. Data represents at least three independent experiments, and two different strains (C57/BL6 and Swiss Webster) of germ-free mice. (B–D) Tabulation of data from individual age-matched mice (8–10 weeks) reared in SPF, GF, or RF conditions: (B) Percentage of CD19+ B cells; (C) % MZ B cells; (D) total MZ B cells per spleen. P values were calculated using student’s t test comparison of GF or RF to the control SPF group.
Figure 5
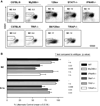
Figure 5. Mice with null mutations in TLR signaling pathways have partial deficiencies in innate-like B cell development
Splenic cells were prepared from MyD88−/− (and C57BL/6 wildtype littermate control) mice, Stat-1−/− and IFNAR−/− (and 129Sv wildtype littermate control) mice, TRIF−/− and TIRAP−/− mice (and 129Sv × C57BL/6 wildtype littermate control). CD19+ cells were analyzed for MZ B cells as in Fig. 5A. (A) Splenic CD21/23 population (MZ B cells). (B) Relative frequency of innate-like B cells in TLR signaling mutant mouse strains. MZ B cells were measured by flow cytometry in sets of background- and age-matched wildtype controls for MyD88−/− (n= 5), TIRAP−/− (n=3), TRIF−/− (n=5), IFNAR−/− (n=4), and STAT-1−/− (n=4) mice. The ratios of mutant to age-matched controls were calculated for each mouse, and tabulated as % control ± SEM. P values for comparisons of mutant to wildtype controls were determined by student t test.
Figure 6
Figure 6. CD8+ T cells affect MZ B cells formation through a perforin-dependent cytolytic mechanism
Splenic lymphocytes were isolated from age- and gender-matched adult C57BL/6 RF mice and stained for CD21, CD23, CD1d, IgM, and IgD in different staining combinations. The MZ B cells were analyzed in CD19+ B cell gate and the percentage of MZ B cells in different staining patterns are indicated. Conventional bacterial culture and molecular phylotyping confirmed that RF mice and RF CD8−/− mice were colonized with the same RF microbiota. (A, B) Comparison of RF mice bearing CD8−/− or wildtype genotypes. (A) Representative flow cytometry of CD19+ gated splenocytes. % MZ B cells are listed. (B) Tabulated percentage and absolute number of MZ B cells in CD19+CD21hiCD23lo gate. The data represents at least three individual experiments. (C–E). Prf1−/− mice bearing SPF or RF microflora were compared with age- and gender-matched wildtype SPF and RF C57/BL6 mice. (C) Representative flow cytometry of CD19+ gated splenocytes. % MZ B cells are listed. Tabulated percentage (D) and absolute number (E) of MZ B cells (CD19+CD21hiCD23lo). P values for the significance of comparisons between different groups were indicated. These data are representative of the results from three independent experiments with nine Pfr1−/− mice and equal numbers of control mice.
Figure 7
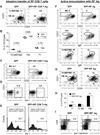
Figure 7. In vivo depletion of MZ B cells by adoptive transfer of RF CD8+ T cells and active immunization with RF microbial antigens in SPF mice
Four weeks old SPF mice were transferred i.v. with 4 ×10⁷ of splenic CD8+ T cells and i.p. with 150 µg of enteric bacterial antigens derived from RF mice. On day 3 after cell transfer, splenocytes were collected from SPF mice and SPF mice that received RF CD8+ T cells plus antigens, and stained for analysis of B cell subsets. The data represent three different independent experiments. (A) Representative flow cytometry of CD19+-gated cells stained for B cell subsets. (B) Tabulated percentages of B cell subsets as compared between SPF mice and SPF mice received RF CD8+ T cells and bacterial antigens. (C, D) Flow cytometry of CD19+-gated splenocytes from representative SPF mice with or without RF CD8+ T cell transfer: (C) CD21 and CD23 (MZ B cells); (D) CD21 and Qa-1 (Qa-1+ B cells). (E) Qa-1 expression of MZ-gated splenocytes (CD19+CD21hiCD23lo). Fig. 7 F–I show the reduction of MZ, T2-MZ B cells and increase of Qa-1b tetramer positive CD8+ T cells in liver of SPF mice actively immunized with RF lumenal antigens through i.p injection. (F) CD21 vs. CD23 (MZ B cells), IgM and IgD, respectively; (G) CD21 vs. CD24 (T2-MZP/MZ B cells); (H) Tabulated percentages of T1, T2-MZ B and FM B cell subsets in T2-MZP/MZ gate shown in Fig 7G. “*” indicates the statistic significance (p=0.02); (I) Lymphocytes from liver of immunized SPF mice stained with CD8+ vs. Qa-1b tetramer loaded with a HSP-60 peptide (GMKFDRGYI). All data represents three individual experiments.
Figure 8
Figure 8. CD8+ T cell binding of Qa-1 tetramer/heat shock peptide
Single cells were isolated from adult C57BL/6 spleen (A, C, E) and liver (B, D, F) of age- and gender-matched adult RF and SPF mice and stained for CD3, CD8+ and Qa-1b tetramer loaded with the murine HSP60 monamer GMKFDRGYI. Flow cytometry from single RF and SPF animals are shown in (A–D), representative of findings from three different experiments. (A, B) CD3 and CD8 expression. (C, D) Level of Qa-1 tetramer binding by CD8+ T cells. Histograms show staining with Qa-1/tetramer (filled) and unstaining negative control (grey trace). (E, F) Tabulated percentage and absolute number of Qa-1 tetramer-binding CD8+ T cells. The data represents the results from three individual experiments.

Similar articles

Cited by

References

    1. Savage DC. Microbial ecology of the gastrointestinal tract. Annu.Rev.Microbiol. 1977;31:107–133. - PubMed
    1. Conway PL. Microbial ecology of the human large intestine. In: Gibson GR, editor. Human colonic bacteria: role in nutrition, physiology, and pathology. Boca Raton: CRC Press; 1995. pp. 1–24.
    1. Mackie RI, Sghir A, Gaskins HR. Developmental microbial ecology of the neonatal gastrointestinal tract. Am J Clin Nutr. 1999;69:1035S–1045S. - PubMed
    1. Ley RE, Peterson DA, Gordon JI. Ecological and evolutionary forces shaping microbial diversity in the human intestine. Cell. 2006;124:837–848. - PubMed
    1. Janeway CA., Jr How the immune system works to protect the host from infection: a personal view. Proceedings of the National Academy of Sciences of the United States of America. 2001;98:7461–7468. - PMC - PubMed

Publication types

Substances