. 2008 Dec;173(6):1617-27.
doi: 10.2353/ajpath.2008.080433. Epub 2008 Nov 13.

Pericytes and perivascular fibroblasts are the primary source of collagen-producing cells in obstructive fibrosis of the kidney

Affiliations

Pericytes and perivascular fibroblasts are the primary source of collagen-producing cells in obstructive fibrosis of the kidney

Shuei-Liong Lin et al. Am J Pathol. 2008 Dec.

Abstract

Understanding the origin of scar-producing myofibroblasts is vital in discerning the mechanisms by which fibrosis develops in response to inflammatory injury. Using a transgenic reporter mouse model expressing enhanced green fluorescent protein (GFP) under the regulation of the collagen type I, alpha 1 (coll1a1) promoter and enhancers, we examined the origins of coll1a1-producing cells in the kidney. Here we show that in normal kidney, both podocytes and pericytes generate coll1a1 transcripts as detected by enhanced GFP, and that in fibrotic kidney, coll1a1-GFP expression accurately identifies myofibroblasts. To determine the contribution of circulating immune cells directly to scar production, wild-type mice, chimeric with bone marrow from coll-GFP mice, underwent ureteral obstruction to induce fibrosis. Histological examination of kidneys from these mice showed recruitment of small numbers of fibrocytes to the fibrotic kidney, but these fibrocytes made no significant contribution to interstitial fibrosis. Instead, using kinetic modeling and time course microscopy, we identified coll1a1-GFP-expressing pericytes as the major source of interstitial myofibroblasts in the fibrotic kidney. Our studies suggest that either vascular injury or vascular factors are the most likely triggers for pericyte migration and differentiation into myofibroblasts. Therefore, our results serve to refocus fibrosis research to injury of the vasculature rather than injury to the epithelium.


Figures
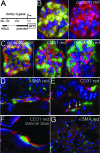
Figure 1
Figure 1
Pericytes and podocytes induce coll1a1 transcripts in normal coll-GFP mouse kidney. A: Coll-GFP transgenic mice were generated by linking the α1(I) collagen gene promoter (−3122 to + 111) and DNase I hypersensitive sites (HS) 4 & 5 (−7kb and −8kb) to GFP. The DNase I HS are position independent regulatory elements that enhance gene transcription in vivo. B: Image (magnification = original ×1000) of the normal glomerulus of coll-GFP mice colabeled with antibodies against podocin (red), and nuclei labeled with DAPI (blue). Right hand panel shows red and blue channels only. Podocytes exclusively express GFP in the glomerulus and colocalize with podocin. C: Coll1a1-GFP-expressing podocytes colocalize with synaptopodin, but do not localize with PDGFRβ (red) or CD31 (red). D: Periarteriolar coll1a1-GFP+ cells are identified surrounding and intimately associated with αSMA+ vascular smooth muscle cells (magnification = original × 1000). E: Interstitial coll1a1-GFP+ cells are identified interacting intimately throughout their length with CD31+ (red) endothelial cells of peritubular capillaries. The interacting coll1a1-GFP+ cells have intimate areas of adhesion with the endothelial cell suggestive of peg and socket processes (arrows), characteristic of pericytes (magnification = original ×1000). F: Three color labeling showing EBM (blue), CD31+ endothelial cells (red) and coll1a1-GFP+ pericytes (green). Note that the coll1a1-GFP+ pericytes are within EBM (magnification = original ×1000) in the cortical peritubular vascular plexus. G: In cortical interstitium labeled with antibodies against αSMA (red) many interstitial coll1a1-GFP+ cells can be seen but they do not express αSMA (magnification = original ×400).
Figure 2
Figure 2
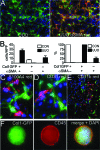
Coll1a1-GFP+ interstitial cells from d7 ureteral obstruction correlate imperfectly with αSMA+ interstitial cells, and a minority co-express the leukocyte marker CD45. A: Photomicrograph of d7 UUO kidney from coll-GFP mice (left panel) co-immunolabeled with antibodies against αSMA (right panel). Note the absence of epithelial tubule expression of GFP and the heterogeneity of αSMA and GFP co-expression (magnification = original × 200). B: Graphs of number of cells per HPF (left panel), and proportion (right panel) of GFP+ interstitial cells that co-express αSMA and the proportion of αSMA+ cells that co-express coll1a1-GFP in normal and d7 UUO kidney. In UUO kidney 25% of αSMA+ cells do not express coll1a1-GFP but 100% of coll1a1-GFP cells express dSMA. C–E: Fluorescent micrograph of d7UUO kidney from coll-GFP mice co-immunolabeled with antibodies against (C) S100A4 (red), magnification = original ×1000; (D) CD31 (red), magnification = original ×1000; or (E) CD11b (red), magnification = original ×200. F: Single cell preparation form d7 UUO kidney showing a single cell co-expressing CD45 (red) and coll1a1-GFP with the nucleus shown (blue), magnification = original ×1000.
Figure 3
Figure 3
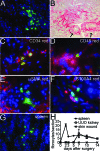
Fibrocyte recruitment to kidney and spleen in response to ureteral obstruction. Male coll-GFP bone marrow was transplanted into female WT lethally irradiated mice. Chimerism was confirmed at 6 weeks by assessing leukocytes for Y chromosome. A: Image of perivascular GFP+ cells in d7 UUO kidney from coll-GFP ⇒WT bone marrow chimeric mice (magnification = original ×400). B: Confirmation of extensive fibrosis in this model by picrosirius red staining of d14 UUO kidney from chimeric mice. Note prominent perivascular fibrosis (arrows) as well as interstitial fibrosis. C–D: Image of d7 in UUO kidney from coll-GFP ⇒WT BM chimeric mice showing GFP+ cells co-expressing CD34 and CD45, confirming these cells to be fibrocytes (magnification = original ×400). E–F: Image of d7 UUO kidney showing BM-derived coll1a1-GFP+ cells lacking αSMA or S100A4 expression (magnification = original ×400). G: Red pulp of spleen from coll-GFP ⇒WT BM chimeric mice, 48 hours after UUO surgery, note the presence of GFP+ cells. H: Time course of fibrocyte recruitment to fibrotic kidney, spleen and full thickness skin wound. Number of cells is per sagittal section for kidney, transverse section of spleen, and transverse section of skin wound.
Figure 4
Figure 4
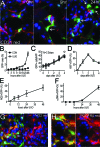
Pericyte migration, proliferation, and differentiation accounts for the appearance of the majority of myofibroblasts in the adult kidney following ureteral obstruction. A: Photomicrographs of pericytes and their relationship to endothelial cells (labeled for CD31 expression) at 0 hours, 9 hours, and 24 hours after UUO surgery. At 0 hours, pericytes are in apposition to endothelial cells and GFP expression is low. At 9 hours GFP expression is increased, the area occupied by pericytes has increased and some have detached from endothelial cells (arrow). At 24 hours many pericytes have migrated away from endothelial cells (arrows) and show evidence of cell enlargement or spreading (magnification = original ×400). B: Time course of GFP area assessed by morphometry in kidney interstitium. By 12 hours there is increased GFP+ area in the kidney compared with sham, reflecting pericyte enlargement or spreading. C: Time course of number of interstitial coll1a1-GFP+ cells/HPF following UUO surgery. From day 0 through day 4 there is an exponential increase in coll1a1-GFP+ cells. The exponential curve was fit to the data giving a Td of 2.2 days. D: Time course of % of Ki-67+ interstitial coll1a1-GFP+ cells. E: Time course of NG2 co-expression with coll1a1-GFP+ interstitial cells. Note induction of NG2 within 6 hours of UUO disease. F: Time course of αSMA co-expression with coll1a1-GFP+ interstitial cells. Induction of αSMA occurs later than NG2. G–H: Photomicrographs of NG2 and PDGFRβ expression by coll1a1-GFP+ interstitial cells 48 hours following induction of UUO. Note right hand panels show red and blue channels only for clarity.
Figure 5
Figure 5
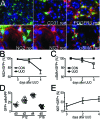
Normal neonatal mouse kidney coll1a1-GFP pericytes express pericyte markers and differentiate into myofibroblasts following ureteral obstruction. A: Low power (magnification = original ×200) view of coll1a1-GFP+ pericytes in P12 normal kidney. Higher power views (magnification = original ×400) of pericytes in P12 normal kidneys showing apposition to CD31+ endothelial cells (upper center panel), co-expression of PDGFRβ (upper right), NG2 (left lower and center panels), and αSMA (lower right). Note, in addition to positive staining of NG2 in coll1a1-GFP+ pericytes, NG2 is cleaved to a soluble form of the proteoglycan that binds to tubule basement membrane. Isotype control antibody labeling for NG2 showed no staining of pericytes or tubule membrane (not shown). B: Time course showing percentage of coll1a1-GFP+ interstitial cells that co-express NG2 in normal aging kidney (P12–P16) or following UUO in P12 mice. Note normal kidney pericytes lose NG2 with aging, but this is prevented by UUO. C: Time course showing percentage of coll1a1-GFP+ interstitial cells that co-express αSMA in normal aging of the kidney (P12 to P16) or following UUO in P12 mice. Note normal kidney pericyte lose αSMA with aging, but this is prevented by UUO. D: Time course of number of coll1a1-GFP+ interstitial cells/HPF following UUO in P12 mice and also in P16 healthy mice. Note a linear increase in coll1a1-GFP+ interstitial cells following UUO, and that the number of coll1a1-GFP+ interstitial cells in healthy mice decreases with aging. E: Time course showing percentage of Ki-67+ interstitial coll1a1-GFP+ cells.
Figure 6
Figure 6
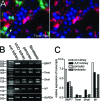
The transcription factors Snai1 and Id1 but not Twist are up-regulated by pericytes when they differentiate into myofibroblasts in vivo. A: P12 neonatal kidney showing Twist expression in cytoplasm and nucleus of many cortical interstitial cells that lack coll1a1-GFP expression, and also a minority of pericytes (arrow), but not epithelial cells (magnification = original ×400). (B) PCR and (C) representative quantitative PCR showing Twist, Snai1, Id1, and Bmp-7 transcripts in adult healthy kidney, UUO kidney (day 7), purified pericytes, and purified coll1a1-GFP+ myofibroblasts d7 UUO. Snail transcripts and Id1 transcripts are up-regulated in myofibroblasts as compared with pericytes.

Similar articles

Cited by

References

    1. Grimm PC, Nickerson P, Jeffery J, Savani RC, Gough J, McKenna RM, Stern E, Rush DN. Neointimal and tubulointerstitial infiltration by recipient mesenchymal cells in chronic renal-allograft rejection. N Engl J Med. 2001;345:93–97. - PubMed
    1. Duffield JS, Bonventre JV. Kidney tubular epithelium is restored without replacement with bone marrow-derived cells during repair after ischemic injury. Kidney Int. 2005;68:1956–1961. - PMC - PubMed
    1. Lin F, Moran A, Igarashi P. Intrarenal cells, not bone marrow-derived cells, are the major source for regeneration in postischemic kidney. J Clin Invest. 2005;115:1756–1764. - PMC - PubMed
    1. Roufosse C, Bou-Gharios G, Prodromidi E, Alexakis C, Jeffery R, Khan S, Otto WR, Alter J, Poulsom R, Cook HT. Bone marrow-derived cells do not contribute significantly to collagen I synthesis in a murine model of renal fibrosis. J Am Soc Nephrol. 2006;17:775–782. - PubMed
    1. Iwano M, Plieth D, Danoff TM, Xue C, Okada H, Neilson EG. Evidence that fibroblasts derive from epithelium during tissue fibrosis. J Clin Invest. 2002;110:341–350. - PMC - PubMed

Publication types

MeSH terms