Comparative Study
. 2008 Nov 12;28(46):11848-61.
doi: 10.1523/JNEUROSCI.3183-08.2008.

Contrasting the functional properties of GABAergic axon terminals with single and multiple synapses in the thalamus

Affiliations
Comparative Study

Contrasting the functional properties of GABAergic axon terminals with single and multiple synapses in the thalamus

Nicolas Wanaverbecq et al. J Neurosci. .

Abstract

Diverse sources of GABAergic inhibition are a major feature of cortical networks, but distinct inhibitory input systems have not been systematically characterized in the thalamus. Here, we contrasted the properties of two independent GABAergic pathways in the posterior thalamic nucleus of rat, one input from the reticular thalamic nucleus (nRT), and one "extrareticular" input from the anterior pretectal nucleus (APT). The vast majority of nRT-thalamic terminals formed single synapses per postsynaptic target and innervated thin distal dendrites of relay cells. In contrast, single APT-thalamic terminals formed synaptic contacts exclusively via multiple, closely spaced synapses on thick relay cell dendrites. Quantal analysis demonstrated that the two inputs displayed comparable quantal amplitudes, release probabilities, and multiple release sites. The morphological and physiological data together indicated multiple, single-site contacts for nRT and multisite contacts for APT axons. The contrasting synaptic arrangements of the two pathways were paralleled by different short-term plasticities. The multisite APT-thalamic pathway showed larger charge transfer during 50-100 Hz stimulation compared with the nRT pathway and a greater persistent inhibition accruing during stimulation trains. Our results demonstrate that the two inhibitory systems are morpho-functionally distinct and suggest and that multisite GABAergic terminals are tailored for maintained synaptic inhibition even at high presynaptic firing rates. These data explain the efficacy of extrareticular inhibition in timing relay cell activity in sensory and motor thalamic nuclei. Finally, based on the classic nomenclature and the difference between reticular and extrareticular terminals, we define a novel, multisite GABAergic terminal type (F3) in the thalamus.


Figures

Figure 1.
Figure 1.
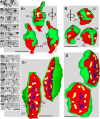
Injection sites and termination zones of the nRT-thalamic and APT-thalamic pathways. A, C, Injection sites in the nRT (A, blue arrows) and in the APT (C, red arrows). Mapping of the termination zone is shown in B with the same color coding. Note that the dense terminal labeling overlaps in the dorsolateral part of the Po. D1–D3, E1–E3, The small nRT terminals (D1–D3, arrowheads) are evenly spaced along the axons, whereas the larger APT boutons form clusters (E1–E3, arrowheads). AD, Anterodorsal thalamic nucleus; AM, anteromedial thalamic nucleus; AVDM, AVVL anteroventral thalamic nucleus dorsomedial and ventrolateral part; CL, centrolateral thalamic n; DpMe, deep mesencephalic nucleus; LDDM, LDVL laterodorsal thalamic nucleus dorsomedial and ventrolateral part; LP, lateral posterior thalamic nucleus; MD, mediodorsal thalamic nucleus; MDG, MGV medial geniculate nucleus dorsal and ventral part; VA, ventral anterior thalamic nucleus; VL, ventrolateral thalamic nucleus; VM, ventromedial thalamic nucleus; VPM, ventral posteromedial thalamic nucleus; VPL, ventral posterolateral thalamic nucleus. Scale bars: A–C, 500 μm. D–E, 10 μm.
Figure 2.
Figure 2.
Ultrastructural features of nRT-thalamic and APT-thalamic terminals in the Po nucleus of rat. A–C, High-power electron microscopic images showing two anterogradely labeled nRT-thalamic (A, B) and an APT-thalamic terminal (C). A2 and C2 are the neighboring sections to A1 and C1, respectively, postembedding immunoreacted for GABA (small black dots). Silver intensified gold particles (empty triangles) indicate the anterograde tracer. The nRT terminals form single synapses (thick arrows in A1, A2, and B) on their targets, which are a thin dendrite receiving unlabeled RS-type terminal in A1 and A2 and a thick dendrite contacted by RL-type terminal in B. The APT terminal forms multiple synapses (thick arrows in C1, C2) and puncta adhaerentia (arrowheads) on a thick dendrite. Three-dimensional reconstruction of the terminal in B and C is shown in Figure 3, A1 and C1, respectively. Note that in A2 and C2, the anterograde signal is absent as a result of the etching procedure of the postembedding GABA immunostaining. d, Dendrites; b, boutons; thin arrows, glial covering; black square in C1 and C2, glia intruding into the APT terminal; da, dendritic appendage. Scale bars, 0.5 μm.
Figure 3.
Figure 3.
Three-dimensional reconstructions of nRT- and APT-thalamic terminals. A, B, Three views of two nRT terminals in Po. Both terminals have multiple synapses (yellow, S1–S4), which face different directions. Each synapse is separated by glial processes (green) and innervates different dendrites (data not shown). Serial EM images (A2–A7) through the symmetrical synapse S1 in A1 demonstrate single uninterrupted postsynaptic specialization (arrows). C, D, Two views of two APT-thalamic terminals. In sharp contrast to nRT terminals, all synapses of a single terminal (12 in C, 9 in D) face one direction and innervate a single dendrite (data not shown). Note that the synapses are organized around a centrally placed network of PA (blue). Glial processes do not separate the synapses, but the entire outer surfaces of the boutons are covered by glia sheaths. Serial EM images (C2–C8) through the symmetrical synapses S1–S3 of C1 demonstrate multiple distinct postsynaptic specialization (arrows) and PA (arrowheads). Red, Membrane of the terminal. Scale bars: A1, B, C1, D, 1 μm; A2–A7, C2–C8, 0.5 μm.
Figure 4.
Figure 4.
Quantitative analysis of the APT and nRT terminals and their targets in Po. A, Comparison of random dendritic diameters to the diameter of targets postsynaptic to nRT-thalamic (white bars; n = 84) and APT-thalamic (gray bars; n = 125) terminals. The distribution of the random dendrite diameters is shown in two ways: as the percentage of dendrites in each bin (black line with squares; left y-axis) and as the percentage of summated perimeter of the dendrites in each bin (black lines with triangles; right y-axis). The first one is used for statistical comparison, whereas the second one better represents the available target surfaces. APT target diameters are skewed toward the larger values, whereas the nRT targets and the random sample overlap. B, Analysis of non-GABAergic terminal types on the dendrites contacted by nRT (first column) or APT (second column) boutons. Note the contrasting pattern of RL and RS inputs in dendrites innervated by nRT and APT terminals. For the description of RL and RS terminals, see Results, Difference in size and postsynaptic targets between nRT-thalamic and APT-thalamic terminals. RL-RS, Both types of input; UI, unidentified. C, Correlation between the volume of the terminals and the number of synapses an individual terminal establishes. Lines represent the linear regression. Note the clear separation of nRT and APT boutons along both the x- and y-axes. D, Correlation between the diameter of the postsynaptic elements (excluding somatic targets) and the number of synapses a terminal establishes with a given target. nRT data, Gray diamonds; APT data, black squares. E, Cumulative distribution of nearest neighbor synaptic distances in APT terminals. F, The average number of APT synapses with increasing distances from a given synapse belonging to a single bouton.
Figure 5.
Figure 5.
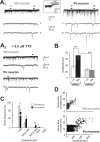
Larger and slower sIPSCs in Po compared with VB. A, Raw sIPSCs (A1) and mIPSCs (A2) for representative VB and Po neurons. A 30 s long recording is shown at the top of each section. Expanded portions, selected from the areas labeled with numbers (A1; sIPSCs) and with black bars (A2; mIPSCs), are presented below. TTX (0.5 μm) was applied to isolate mIPSCs. Inset, Membrane current response of a Po neuron to bath application of the GABAA receptor antagonist bicuculline (+Bic, 25 μm). B, Histogram of average sIPSC (n = 10 for VB, n = 9 for Po) and mIPSC amplitudes (n = 8 for VB, n = 9 for Po). ***p < 0.001. C, Histogram of the frequency distribution for sIPSC amplitudes binned by their size, as indicated on the abscissa. *p < 0.05; **p < 0.01. D, Distribution of sIPSC decay time constants as a function of sIPSC amplitude. Data were pooled from 10 VB and 9 Po neurons. Note slower decay of the large events in Po.
Figure 6.
Figure 6.
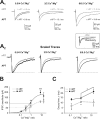
Unitary IPSCs evoked in APT are larger and slower than IPSCs evoked in nRT but show similar dependence on the ratio of Ca2+/Mg2+ ions. A, Representative traces of nRT- and APT-IPSCs (averaged from 10 to 50 sweeps). In A1, superimposed nRT-IPSCs and APT-IPSCs, evoked at three different Ca2+/Mg2+ ratios (indicated above traces) are presented with monoexponential decay time constants (τ) next to the traces. Inset, APT-IPSC before, during, and after bicuculline (Bic, 25 μm). In A2, traces from A1 are shown scaled to their peak. Note slower decay of APT-IPSC at all Ca2+/Mg2+ ratios. B, Sigmoidal dependence of evoked nRT- and APT-IPSC amplitudes on the Ca2+/Mg2+ ratio (n = 4–12 per data point for both nRT and APT). Three different ratios were tested per experiment. Data were fitted with a Hill equation (dotted line for nRT-IPSCs; continuous line for APT-IPSCs), yielding r2 = 0.99 for nRT-IPSCs and 0.97 for APT-IPSCs. Horizontal and vertical lines indicate the half-maximal Ca2+/Mg2+ ratio for both curves (see Results). **p < 0.01; ***p < 0.001. C, Dependence of decay time constants on the Ca2+/Mg2+ ratio (for nRT, n = 3, 9, 3, for APT, n = 10, 16, 10 for Ca2+/Mg2+ ratios of 0.125, 1, 16). *p < 0.05. Asterisks below open circles refer to significance between nRT and APT values, whereas asterisks next to the line denote significance between two Ca2+/Mg2+ ratios for APT-IPSCs.
Figure 7.
Figure 7.
Variance-mean analysis of unitary nRT- and APT-IPSCs. A1, B1, Family of nRT- and APT-IPSCs obtained at different Ca2+/Mg2+ ratios. For every Ca2+/Mg2+ ratio, 10 individual sweeps (gray traces) are shown superimposed together with the average of 100 sweeps (black trace). For the 0.5 Ca2+/4 mm Mg2+ ratio, the means of the 89 failures recorded for nRT-IPSCs and of the 78 failures for APT-IPSCs are also shown. A2, B2, Time course of evoked IPSC amplitude recordings during successive applications of three different Ca2+/Mg2+ ratios, indicated above the bars. Corresponding series resistances are shown below, with dashed lines indicating the ±20% tolerance level. A3, B3, Variance-mean plot for nRT- and APT-IPSCs presented in A and B, with the weighted fit shown overlaid in continuous lines. The fit from simulated data (sim) is shown in the same plot (dotted lines). C, Average values for N and q obtained from the weighted fit (exp, n = 9 for nRT, n = 12 for APT) and from the fit to the simulated data (sim, n = 4 for nRT, n = 7 for APT). D, Sigmoidal dependence of release probabilities on the Ca2+/Mg2+ ratio, as obtained from the variance–mean analysis. Data were fit with a Hill equation (nRT, dotted line; APT, continuous line), yielding r2 = 0.98 for nRT and 0.96 for APT. Prob, Probability.
Figure 8.
Figure 8.
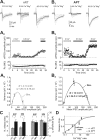
Short-term plasticity of nRT- and APT-IPSCs during multipulse stimulation. A1–A3, Representative recordings of 10 successive IPSCs elicited at the frequencies indicated after stimulation of nRT (top) or APT terminals (middle). The nRT- (gray traces) and APT-IPSCs (black traces) were normalized to the first peak amplitude (scaled traces) and superimposed for a better comparison. B1–B3, Normalized cumulative summation of 10 successive IPSCs (IPSCs total) after stimulation of nRT (open circles, n = 5) or APT projections (black circles, n = 3 for 10 Hz, n = 5 for 50 and 100 Hz). C1–C3, Normalized persistent current amplitudes of 10 successive nRT- or APT-IPSCs. Note the greater current component developing in APT, as opposed to nRT-IPSCs. For B, C, *p < 0.05. D1–D3, Charge transfer during multipulse stimulation. D1, Schematic illustration of charge transfer calculation, performed for 10 stimuli or for 100 ms (see also Materials and Methods). D2, Ratio of charge transfer for 10 IPSCs, with respect to the first IPSC in the train. D3, Ratio of charge transfer after 100 ms of stimulation, with respect to the first IPSC. *p < 0.05; **p < 0.01. Persist, Persistent.

Similar articles

Cited by

References

    1. Auger C, Kondo S, Marty A. Multivesicular release at single functional synaptic sites in cerebellar stellate and basket cells. J Neurosci. 1998;18:4532–4547. - PMC - PubMed
    1. Barthó P, Freund TF, Acsády L. Selective GABAergic innervation of thalamic nuclei from zona incerta. Eur J Neurosci. 2002;16:999–1014. - PubMed
    1. Berod A, Hartman BK, Pujol JF. Importance of fixation in immunohistochemistry: use of formaldehyde solutions at variable pH for the localization of tyrosine hydroxylase. J Histochem Cytochem. 1981;29:844–850. - PubMed
    1. Biró AA, Holderith NB, Nusser Z. Quantal size is independent of the release probability at hippocampal excitatory synapses. J Neurosci. 2005;25:223–232. - PMC - PubMed
    1. Biró AA, Holderith NB, Nusser Z. Release probability-dependent scaling of the postsynaptic responses at single hippocampal GABAergic synapses. J Neurosci. 2006;26:12487–12496. - PMC - PubMed

Publication types

MeSH terms

Substances

LinkOut - more resources