Comparative Study
. 2009 Jan;83(2):687-700.
doi: 10.1128/JVI.01281-08. Epub 2008 Nov 12.

Analysis of the differential host cell nuclear proteome induced by attenuated and virulent hemorrhagic arenavirus infection

Affiliations
Comparative Study

Analysis of the differential host cell nuclear proteome induced by attenuated and virulent hemorrhagic arenavirus infection

Gavin C Bowick et al. J Virol. 2009 Jan.

Abstract

Arenaviruses are important emerging pathogens and include a number of hemorrhagic fever viruses classified as NIAID category A priority pathogens and CDC potential biothreat agents. Infection of guinea pigs with the New World arenavirus Pichindé virus (PICV) has been used as a biosafety level 2 model for the Lassa virus. Despite continuing research, little is known about the molecular basis of pathogenesis, and this has hindered the design of novel antiviral therapeutics. Modulation of the host response is a potential strategy for the treatment of infectious diseases. We have previously investigated the global host response to attenuated and lethal arenavirus infections by using high-throughput immunoblotting and kinomics approaches. In this report, we describe the differential nuclear proteomes of a murine cell line induced by mock infection and infection with attenuated and lethal variants of PICV, investigated by using two-dimensional gel electrophoresis. Spot identification using tandem mass spectrometry revealed the involvement of a number of proteins that regulate inflammation via potential modulation of NF-kappaB activity and of several heterogeneous nuclear ribonuclear proteins. Pathway analysis revealed a potential role for transcription factor XBP-1, a transcription factor involved in major histocompatibility complex II (MHC-II) expression; differential DNA-binding activity was revealed by electrophoretic mobility shift assay, and differences in surface MHC-II expression were seen following PICV infection. These data are consistent with the results of several previous studies and highlight potential differences between transcriptional and translational regulation. This study provides a number of differentially expressed targets for further research and suggests that key events in pathogenesis may be established early in infection.


Figures

FIG. 1.
FIG. 1.
Summary of protein level changes over time following infection with P2 or P18 PICV. All up- and downregulated spots with a twofold or greater difference which were identified in duplicate or triplicate gels were tallied for each time point. Spots which were present or absent in one gel were recorded as upregulated or downregulated, respectively. Comparisons refer to the observation for the virus-infected sample or, in the case of P2 versus P18, for the P2-infected sample; M refers to mock infection. The y axis shows the number of >twofold differences. Individual protein changes can be found in Table S1 in the supplemental material. v, versus; hpi, hours postinfection.
FIG. 2.
FIG. 2.
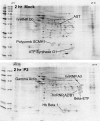
Representative gels showing proteins identified by MS-MS following 2D-PAGE. 2D electrophoresis was performed in triplicate on nuclear extracts from mock-, P2-, and P18-infected cells harvested at various times postinfection. Expression changes of proteins which showed >twofold differences between treatments in two or three of the gels were considered significant. One hundred ninety spots were selected for protein identification by MS-MS. The figure shows representative gels from mock- and P2-infected samples. The spots which were identified as having an expectation threshold of <10−6 are annotated. The proteins shown here correspond to the first two sections in Table S1 in the supplemental material. Boxed numbers are the spot identification numbers allocated by the software.
FIG. 3.
FIG. 3.
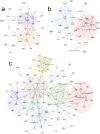
Pathway analysis reveals protein networks and key “hubs” of interaction. Significant proteins identified at all time points for each comparison were uploaded to the Ingenuity pathway analysis software using SwissPROT identifiers. Networks which met the cutoff threshold (score of >5) were merged to form the interaction networks shown. Proteins shown backed by gray symbols are those which were present in the data set, and proteins backed by white symbols were included in the networks on the basis of known interactions. Shaded regions highlight the subnetworks of interaction within each global network. Proteins in shaded regions are those directly identified from differentially expressed spots, and proteins in unshaded regions are those brought into the networks on the basis of known interactions mined from the literature. The networks are described in Results. (a) Mock versus P2. (b) Mock versus P18. (c) P2 versus P18.
FIG. 4.
FIG. 4.
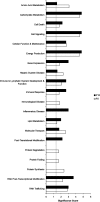
Functional significance of identified proteins. The Ingenuity pathway analysis software was used to perform a comparison analysis on the proteins that were differentially expressed/modified in P2- or P18-infected cells compared to their levels in mock-infected cells. These proteins are assigned roles in functional and disease processes on the basis of published reports. The bar represents the statistical involvement of proteins in these processes rather than an increase or decrease in process activity. The dashed line indicates the threshold of statistical significance.
FIG. 5.
FIG. 5.
Example of differential hnRNP expression in P2- and mock-infected cells. Representative gels showing differences in hnRNP expression. The spots found to be hnRNP family members in the 2-h-time-point gels were identified with the Progenesis software. The spots shown in the figure correspond to the hnRNP proteins shown in the 2-h section of Table S1 in the supplemental material.
FIG. 6.
FIG. 6.
hnRNP proteins show differential subcellular locations in P2- and P18-infected cells. P388D1 cells were mock (M), P2, or P18 infected in triplicate, and nuclear and cytoplasmic extracts prepared at various times postinfection. Samples were denatured in SDS-containing buffer and resolved by PAGE. Samples were immunoblotted with antibodies against hnRNP A1 and hnRNP A2/B1.
FIG. 7.
FIG. 7.
P2 and P18 infection induced differential XBP-1 binding to DNA and MHC-II surface expression. (a) Nuclear extracts from mock-, P2-, and P18-infected cells were harvested at 4 and 16 h postinfection and assayed by gel shift assay for their ability to bind two MHC-II promoter elements. Probes DRAX and DPBX are described in Materials and Methods. M, mock infection. (b) Surface expression of MHC-II on mock-, P2-, or P18-infected macrophages was assayed at 12 and 48 h postinfection by flow cytometry.
FIG. 8.
FIG. 8.
A regulatory network for the inflammatory response. Several proteins identified in this study (described in Discussion) with a known function in regulating the NF-κB response were used to construct a potential regulatory network for NF-κB. Grids next to the proteins indicate nuclear protein and transcriptome expression differences characterized in this study and that of Djavani et al. (22). The upper row of each box indicates changes in levels of nuclear proteins in this study, and the lower row transcriptional expression changes in LCMV-infected macaques in the study of Djavani et al.; red indicates upregulation, and green indicates downregulation. The columns represent, from left to right, mock versus attenuated infection, mock versus severe infection, and attenuated versus severe infection with PICV P2 and P18 in our study and LCMV Armstrong and WE in the transcriptome study. CREB3L1, cyclic-AMP-responsive element binding protein 3-like 1; VCP, valosin-containing protein; HSPA5, 78-kDa glucose-regulated protein precursor (heat shock 70-kDa protein 5); PPARG, peroxisome proliferative activated receptor gamma; NR3C1, nuclear receptor subfamily 3 group C member 1; CREBBP, CREB binding protein; Hsp70, heat shock protein 70 (group); NFKBIA, nuclear factor κB inhibitor α (IκB-α); RELA, NF-κB p65 subunit. Solid lines indicate direct interactions between proteins, broken lines indicate an indirect interaction, an ellipse represents a transcriptional regulator, a rectangle represents a ligand-dependent nuclear receptor, a diamond represents an enzyme, concentric circles represent a group or complex, and a single circle represents other functions.

Similar articles

Cited by

References

    1. Althage, A., B. Odermatt, D. Moskophidis, T. Kundig, U. Hoffman-Rohrer, H. Hengartner, and R. M. Zinkernagel. 1992. Immunosuppression by lymphocytic choriomeningitis virus infection: competent effector T and B cells but impaired antigen presentation. Eur. J. Immunol. 221803-1812. - PubMed
    1. Amlie-Lefond, C., D. A. Paz, M. P. Connelly, G. B. Huffnagle, K. S. Dunn, N. T. Whelan, and H. T. Whelan. 2005. Innate immunity for biodefense: a strategy whose time has come. J. Allergy Clin. Immunol. 1161334-1342. - PMC - PubMed
    1. Amman, B. R. 2007. Pet rodents and fatal lymphocytic choriomeningitis in transplant patients. Emerg. Infect. Dis. 13719-725. - PMC - PubMed
    1. Andrade, A. A., P. N. Silva, A. C. Pereira, L. P. De Sousa, P. C. Ferreira, R. T. Gazzinelli, E. G. Kroon, C. Ropert, and C. A. Bonjardim. 2004. The vaccinia virus-stimulated mitogen-activated protein kinase (MAPK) pathway is required for virus multiplication. Biochem. J. 381437-446. - PMC - PubMed
    1. Aronson, J. F., N. K. Herzog, and T. R. Jerrells. 1994. Pathological and virological features of arenavirus disease in guinea-pigs: comparison of 2 Pichinde virus-strains. Am. J. Pathol. 145228-235. - PMC - PubMed

Publication types