Toward targeting B cell cancers with CD4+ CTLs: identification of a CD19-encoded minor histocompatibility antigen using a novel genome-wide analysis
- PMID: 19001137
- PMCID: PMC2585855
- DOI: 10.1084/jem.20080713
Toward targeting B cell cancers with CD4+ CTLs: identification of a CD19-encoded minor histocompatibility antigen using a novel genome-wide analysis
Abstract
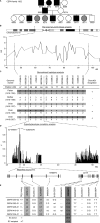
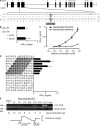
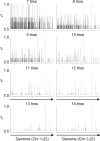
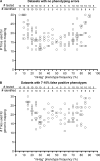
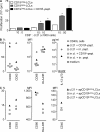
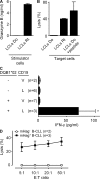
Some minor histocompatibility antigens (mHags) are expressed exclusively on patient hematopoietic and malignant cells, and this unique set of antigens enables specific targeting of hematological malignancies after human histocompatability leucocyte antigen (HLA)-matched allogeneic stem cell transplantation (allo-SCT). We report the first hematopoietic mHag presented by HLA class II (HLA-DQA1*05/B1*02) molecules to CD4(+) T cells. This antigen is encoded by a single-nucleotide polymorphism (SNP) in the B cell lineage-specific CD19 gene, which is an important target antigen for immunotherapy of most B cell malignancies. The CD19(L)-encoded antigen was identified using a novel and powerful genetic strategy in which zygosity-genotype correlation scanning was used as the key step for fine mapping the genetic locus defined by pairwise linkage analysis. This strategy was also applicable for genome-wide identification of a wide range of mHags. CD19(L)-specific CD4(+) T cells provided antigen-specific help for maturation of dendritic cells and for expansion of CD8(+) mHag-specific T cells. They also lysed CD19(L)-positive malignant cells, illustrating the potential therapeutic advantages of targeting this novel CD19(L)-derived HLA class II-restricted mHag. The currently available immunotherapy strategies enable the exploitation of these therapeutic effects within and beyond allo-SCT settings.
Figures

Similar articles
-
The PANE1 gene encodes a novel human minor histocompatibility antigen that is selectively expressed in B-lymphoid cells and B-CLL.Blood. 2006 May 1;107(9):3779-86. doi: 10.1182/blood-2005-08-3501. Epub 2006 Jan 3. Blood. 2006. PMID: 16391015 Free PMC article.
-
Towards effective and safe immunotherapy after allogeneic stem cell transplantation: identification of hematopoietic-specific minor histocompatibility antigen UTA2-1.Leukemia. 2013 Mar;27(3):642-9. doi: 10.1038/leu.2012.277. Epub 2012 Oct 1. Leukemia. 2013. PMID: 23079962 Free PMC article.
-
The human cathepsin H gene encodes two novel minor histocompatibility antigen epitopes restricted by HLA-A*3101 and -A*3303.Br J Haematol. 2006 Aug;134(4):406-16. doi: 10.1111/j.1365-2141.2006.06205.x. Epub 2006 Jul 4. Br J Haematol. 2006. PMID: 16822283
-
Identification of CD19 and CD20 peptides for induction of antigen-specific CTLs against B-cell malignancies.Clin Cancer Res. 2005 Feb 15;11(4):1629-38. doi: 10.1158/1078-0432.CCR-04-1612. Clin Cancer Res. 2005. PMID: 15746068
-
Targeting haematopoietic-specific minor histocompatibility antigens to distinguish graft-versus-tumour effects from graft-versus-host disease.Best Pract Res Clin Haematol. 2008 Sep;21(3):543-57. doi: 10.1016/j.beha.2008.06.001. Best Pract Res Clin Haematol. 2008. PMID: 18790454 Review.
Cited by
-
Correlation of high-resolution X-ray micro-computed tomography with bioluminescence imaging of multiple myeloma growth in a xenograft mouse model.Calcif Tissue Int. 2009 Nov;85(5):434-43. doi: 10.1007/s00223-009-9284-0. Epub 2009 Oct 9. Calcif Tissue Int. 2009. PMID: 19816649 Free PMC article.
-
Impact of genomic polymorphisms on the repertoire of human MHC class I-associated peptides.Nat Commun. 2014 Apr 9;5:3600. doi: 10.1038/ncomms4600. Nat Commun. 2014. PMID: 24714562 Free PMC article.
-
Clinical Impact of Single Nucleotide Polymorphism in CD-19 on Treatment Outcome in FMC63-CAR-T Cell Therapy.Cancers (Basel). 2023 Jun 5;15(11):3058. doi: 10.3390/cancers15113058. Cancers (Basel). 2023. PMID: 37297020 Free PMC article.
-
HapMap SNP Scanner: an online program to mine SNPs responsible for cell phenotype.Tissue Antigens. 2012 Aug;80(2):119-25. doi: 10.1111/j.1399-0039.2012.01883.x. Epub 2012 May 8. Tissue Antigens. 2012. PMID: 22568758 Free PMC article.
-
Tumor-reactive CD4(+) T cells develop cytotoxic activity and eradicate large established melanoma after transfer into lymphopenic hosts.J Exp Med. 2010 Mar 15;207(3):637-50. doi: 10.1084/jem.20091918. Epub 2010 Feb 15. J Exp Med. 2010. PMID: 20156971 Free PMC article.
References
-
- Parkin, D.M., F. Bray, J. Ferlay, and P. Pisani. 2005. Global cancer statistics, 2002. CA Cancer J. Clin. 55:74–108. - PubMed
-
- Goulmy, E. 1997. Human minor histocompatibility antigens: new concepts for marrow transplantation and adoptive immunotherapy. Immunol. Rev. 157:125–140. - PubMed
-
- de Bueger, M., A. Bakker, J.J. van Rood, F. Van der Woude, and E. Goulmy. 1992. Tissue distribution of human minor histocompatibility antigens. Ubiquitous versus restricted tissue distribution indicates heterogeneity among human cytotoxic T lymphocyte-defined non-MHC antigens. J. Immunol. 149:1788–1794. - PubMed
-
- Warren, E.H., P.D. Greenberg, and S.R. Riddell. 1998. Cytotoxic T-lymphocyte-defined human minor histocompatibility antigens with a restricted tissue distribution. Blood. 91:2197–2207. - PubMed
-
- den Haan, J.M., N.E. Sherman, E. Blokland, E. Huczko, F. Koning, J.W. Drijfhout, J. Skipper, J. Shabanowitz, D.F. Hunt, and V.H. Engelhard. 1995. Identification of a graft versus host disease-associated human minor histocompatibility antigen. Science. 268:1476–1480. - PubMed
Publication types
MeSH terms
Substances
LinkOut - more resources
Full Text Sources
Other Literature Sources
Research Materials

