

Floral morphogenesis: stochastic explorations of a gene network epigenetic landscape
- PMID: 18978941
- PMCID: PMC2572848
- DOI: 10.1371/journal.pone.0003626
Floral morphogenesis: stochastic explorations of a gene network epigenetic landscape
Abstract
In contrast to the classical view of development as a preprogrammed and deterministic process, recent studies have demonstrated that stochastic perturbations of highly non-linear systems may underlie the emergence and stability of biological patterns. Herein, we address the question of whether noise contributes to the generation of the stereotypical temporal pattern in gene expression during flower development. We modeled the regulatory network of organ identity genes in the Arabidopsis thaliana flower as a stochastic system. This network has previously been shown to converge to ten fixed-point attractors, each with gene expression arrays that characterize inflorescence cells and primordial cells of sepals, petals, stamens, and carpels. The network used is binary, and the logical rules that govern its dynamics are grounded in experimental evidence. We introduced different levels of uncertainty in the updating rules of the network. Interestingly, for a level of noise of around 0.5-10%, the system exhibited a sequence of transitions among attractors that mimics the sequence of gene activation configurations observed in real flowers. We also implemented the gene regulatory network as a continuous system using the Glass model of differential equations, that can be considered as a first approximation of kinetic-reaction equations, but which are not necessarily equivalent to the Boolean model. Interestingly, the Glass dynamics recover a temporal sequence of attractors, that is qualitatively similar, although not identical, to that obtained using the Boolean model. Thus, time ordering in the emergence of cell-fate patterns is not an artifact of synchronous updating in the Boolean model. Therefore, our model provides a novel explanation for the emergence and robustness of the ubiquitous temporal pattern of floral organ specification. It also constitutes a new approach to understanding morphogenesis, providing predictions on the population dynamics of cells with different genetic configurations during development.
Conflict of interest statement
Figures
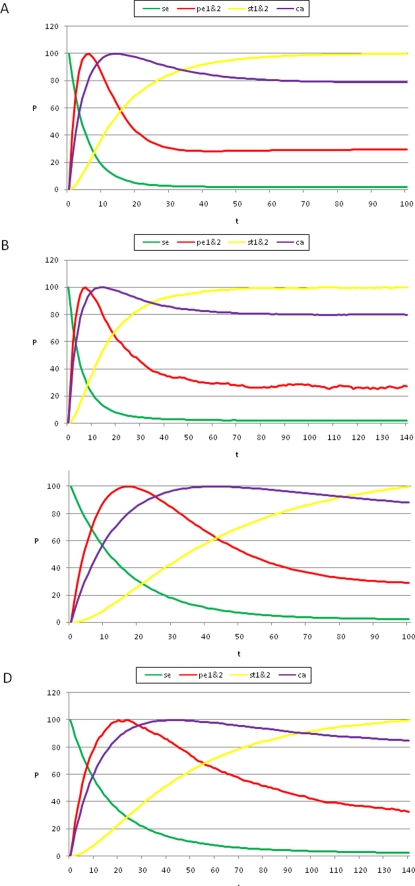
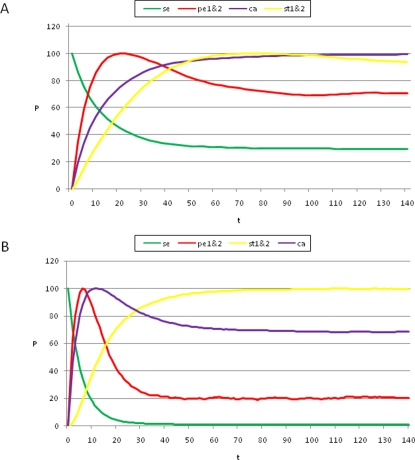
 initialized at the sepal attractor. The error probability in computing this graph was η = 0.03. The most probable sequence of cell attainment is: Sepals, petals, carpels, and stamens. (B) Probability of attaining each attractor (i.e., cell type) at each iteration when 80000 randomly chosen “sepal” configurations were selected and followed for 140 steps. Noise was introduced in the updating of each gene independently, with a η = 0.03 probability at each iteration. The probabilities for the petal (p) and stamen (st) attractors correspond to the sum of p1+p2 and st1+st2, respectively. All maxima correspond to 100 because each absolute probability value was divided by the maximum of each attractor's curve (see Results and Methods). Equivalent graphs to those in (A) and (B) for η = 0.01 are shown in (C) and (D), respectively.

Similar articles
-
The Arabidopsis thaliana flower organ specification gene regulatory network determines a robust differentiation process.J Theor Biol. 2010 Jun 7;264(3):971-83. doi: 10.1016/j.jtbi.2010.03.006. Epub 2010 Mar 18. J Theor Biol. 2010. PMID: 20303988
-
A gene regulatory network model for cell-fate determination during Arabidopsis thaliana flower development that is robust and recovers experimental gene expression profiles.Plant Cell. 2004 Nov;16(11):2923-39. doi: 10.1105/tpc.104.021725. Epub 2004 Oct 14. Plant Cell. 2004. PMID: 15486106 Free PMC article.
-
Gene regulatory network models for floral organ determination.Methods Mol Biol. 2014;1110:441-69. doi: 10.1007/978-1-4614-9408-9_26. Methods Mol Biol. 2014. PMID: 24395275
-
From ABC genes to regulatory networks, epigenetic landscapes and flower morphogenesis: making biological sense of theoretical approaches.Semin Cell Dev Biol. 2010 Feb;21(1):108-17. doi: 10.1016/j.semcdb.2009.11.010. Epub 2009 Nov 13. Semin Cell Dev Biol. 2010. PMID: 19922810 Review.
-
Specification of floral organs in Arabidopsis.J Exp Bot. 2014 Jan;65(1):1-9. doi: 10.1093/jxb/ert385. Epub 2013 Nov 25. J Exp Bot. 2014. PMID: 24277279 Review.
Cited by
-
The flowering transition pathways converge into a complex gene regulatory network that underlies the phase changes of the shoot apical meristem in Arabidopsis thaliana.Front Plant Sci. 2022 Aug 9;13:852047. doi: 10.3389/fpls.2022.852047. eCollection 2022. Front Plant Sci. 2022. PMID: 36017258 Free PMC article.
-
Biological physics in México: Review and new challenges.J Biol Phys. 2011 Mar;37(2):167-84. doi: 10.1007/s10867-011-9218-8. Epub 2011 Feb 11. J Biol Phys. 2011. PMID: 22379227 Free PMC article.
-
Flower development.Arabidopsis Book. 2010;8:e0127. doi: 10.1199/tab.0127. Epub 2010 Mar 23. Arabidopsis Book. 2010. PMID: 22303253 Free PMC article.
-
Gene regulatory network underlying the immortalization of epithelial cells.BMC Syst Biol. 2017 Feb 16;11(1):24. doi: 10.1186/s12918-017-0393-5. BMC Syst Biol. 2017. PMID: 28209158 Free PMC article.
-
Noise and robustness in phyllotaxis.PLoS Comput Biol. 2012;8(2):e1002389. doi: 10.1371/journal.pcbi.1002389. Epub 2012 Feb 16. PLoS Comput Biol. 2012. PMID: 22359496 Free PMC article.
References
-
- Von Dassow G, Meir E, Munro EM, Odell GM. The segment polarity network is a robust developmental module. Nature. 2000;406:188–193. - PubMed
-
- Kauffman SA. The Origins of Order: Self-organization and Selection in Evolution. Oxford: Oxford University Press; 1993.
-
- Davidson E, Rast JP, Oliveri P, Ransick A, Calestani C, et al. A genomic regulatory network for development. Science. 2002;295:1669–1678. - PubMed
Publication types
MeSH terms
LinkOut - more resources
Full Text Sources
