. 2008 Oct 23;60(2):308-20.
doi: 10.1016/j.neuron.2008.08.012.

Synaptic signaling by all-trans retinoic acid in homeostatic synaptic plasticity

Affiliations

Synaptic signaling by all-trans retinoic acid in homeostatic synaptic plasticity

Jason Aoto et al. Neuron. .

Abstract

Normal brain function requires that the overall synaptic activity in neural circuits be kept constant. Long-term alterations of neural activity lead to homeostatic regulation of synaptic strength by a process known as synaptic scaling. The molecular mechanisms underlying synaptic scaling are largely unknown. Here, we report that all-trans retinoic acid (RA), a well-known developmental morphogen, unexpectedly mediates synaptic scaling in response to activity blockade. We show that activity blockade increases RA synthesis in neurons and that acute RA treatment enhances synaptic transmission. The RA-induced increase in synaptic strength is occluded by activity blockade-induced synaptic scaling. Suppression of RA synthesis prevents synaptic scaling. This form of RA signaling operates via a translation-dependent but transcription-independent mechanism, causes an upregulation of postsynaptic glutamate receptor levels, and requires RARalpha receptors. Together, our data suggest that RA functions in homeostatic plasticity as a signaling molecule that increases synaptic strength by a protein synthesis-dependent mechanism.


Figures

Figure 1
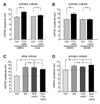
Figure 1. RA induces synaptic scaling
(A) Representative mEPSC traces from control (DMSO) and RA-treated neurons in dissociated cultures. Scale bar: 20 pA, 20 ms. (B) Acute RA (1 µM) treatment in cultured hippocampal slices significantly increased the amplitude but not frequency of mEPSCs in the pyramidal neurons (DMSO, n = 11; RA, n = 16; *, p < 0.0005). (C) RA treatment increased mEPSC amplitudes in dissociated neuronal cultures (n = 11 for each group; *, p < 0.01). (D) and (E) RA scaled up mEPSC amplitudes multiplicatively. (D) Ranked RA amplitudes were plotted against ranked control amplitudes (green dots), and the data is best described by a multiplicative (solid line), not an additive (dashed line), increase in mEPSC amplitudes. Red dots are control plotted against control, and have a slope of 1. Best fit: RA = control × 1.68 – 5.14, R = 0.989, p < 0.0001. (E) The cumulative distribution of mEPSC amplitudes from DMSO- (red) and RA (green)-treated neurons (n = 11 for each group). Scaling up the DMSO distribution by a factor of 1.68 produced a good fit to the RA-treated distribution (black line). (F) The average mEPSC frequency is not changed by RA treatment (n = 11 for each group, p > 0.9). (G) Acute RA treatment did not induce new spine formation. GFP-transfected neurons were treated with DMSO or 1 µM RA for one hour and fixed. No obvious morphological changes induced by RA were observed. Scale bar: 5 µm.
Figure 2
Figure 2. RA mediates activity blockade-induced synaptic scaling
(A) Citral, a ROLDH inhibitor, blocked TTX+APV-induced synaptic scaling. Neurons were treated with citral (5 µM) or DMSO together with TTX+APV for 24 hrs before electrophysiology recording. While TTX+APV alone induced synaptic scaling (n = 10 for each group, *, p < 1 × 10⁻⁴), no synaptic scaling was induced by activity blockade (n = 9 for each group, p > 0.2). (B) DEAB (10 µM), a RALDH inhibitor, also blocked TTX+APV-induced synaptic scaling (n = 11 for each group, *, p < 0.005; n.s., p > 0.5). (C) Blocking neuronal activity in cultured slices with TTX and APV induced synaptic scaling and occluded further increase by subsequent RA treatment (n = 10/group, *, p < 0.005). (D) Activity blockade-induced synaptic scaling occluded further RA-induced scaling in primary cultures (n = 10/group; *, p < 0.01).
Figure 3
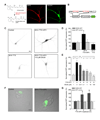
Figure 3. Activity blockade increases RA production in neurons
(A) RALDH1 expression in hippocampal neurons. 13 DIV hippocampal neurons showed strong immunoreactivity to RALDH1 (green). Neuronal dendrites and cell bodies are labeled with MAP2 antibody (red). Scale bar, 10 µm. (B) Schematics of the 3xDR5-RARE-GFP reporter construct. GFP reporter is driven by a thymidine kinase (TK) promoter. The transcription is regulated by an upstream RARE sequence consisting of 3 copies of DR5-RARE. (C) Example images of 3xDR5-RARE-GFP reporter expression in neurons under various treatment. Scale bar, 10 µm. (D) Activity blockade by TTX and APV for 24 hrs significantly increased 3xDR5-RARE-GFP reporter expression in neurons without changing control GFP expression (n = 10/group; *, p < 1 × 10⁻⁴, single factor ANOVA). TTX treatment for 24 hours did not increase reporter expression (n = 9, p > 0.3). (E) DEAB blocked the increase in 3xDR5-RARE-GFP reporter expression by TTX+APV treatment in a dose-dependent manner (n = 10/group; *, p < 0.0005; n.s., p > 0.4). (F) and (G) Prolonged neuronal activity blockade (> 8 hrs) significantly increased GFP expression levels in co-plated HEK293 cells transfected with 3xDR5-RARE-GFP reporter without affecting control GFP expression (n = 15/group, *, p < 0.01). Scale bar, 10 µm. Single-factor ANOVA was used for all statistical analysis. Error bars represent SEM.
Figure 4
Figure 4. RA increased surface delivery of homomeric GluR1 receptors
(A) Surface staining of GluR1 and GluR2 in neurons after 30 minutes of DMSO or RA treatment. The staining was performed an hour after drug washout. Scale bar, 10 µm. (B) RA treatment increased surface GluR1 levels without affecting GluR2 levels (n = 10 neurons/group; *, p < 0.0005). (C) Biotinylation of surface GluR1 in primary cultured neurons after 30 minutes of DMSO or RA treatment, or after 24 hours of TTX+APV treatment. (D) Both RA treatment and activity blockade increased surface GluR1 expression, but no additional increase by RA following 24-hr TTX and APV treatment was observed (n = 3; *, p < 0.01). (E) and (F) RA-induced increase in synaptic transmission is completely blocked by Philanthotoxin-433 (PhTx, 5 µM) in dissociated hippocampal cultures (n = 8; *, p < 0.05). PhTx was bath-applied 10 minutes prior to the recording. Scale bar in E: 20 pA, 20 ms. (G) RA-induced increase in mEPSC amplitude in neurons from cultured slices was also sensitive to PhTx treatment (n = 10; *, p < 0.01). Single-factor ANOVA was used for all statistical analysis. Error bars represent SEM.
Figure 5
Figure 5. RA induced synaptic scaling is independent of transcription
(A) and (B) RA-induced synaptic scaling was blocked by the protein synthesis inhibitor anisomycin, but not by the transcription inhibitor actinomycin D in hippocampal pyramidal neurons from both slice culture (A) and dissociated culture (B) (n = 10/group; *, p < 0.005). Drug treatment was started 30 minutes prior to the RA treatment and was washed out together with RA. (C) Surface GluR1 levels in neurons were selectively increased by RA treatment, whereas GluR2 levels remained unchanged. The increase in GluR1 surface expression was blocked by either cycloheximide or anisomycin, but not by actinomycin D (n = 5; *, p < 0.01).
Figure 6
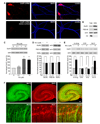
Figure 6. RA induces local translation of GluR1 proteins
(A) GluR1 mRNA was detected in neuronal dendrites as well as in glia cells. Antisense or sense probes against GluR1 mRNA (red) was used for fluorescent in situ hybridization. Neuronal soma and dendrites were labeled with MAP2 antibody (blue). Scale bar, 10 µm. (B) GluR1 and PSD-95 were enriched in, and histone H3 was selectively absent from, the hippocampal synaptoneurosome fraction relative to the whole-cell lysate. (C) Ten minute RA treatment (0.1, 1 or 10 µM) induced GluR1 synthesis in synaptoneurosomes (n = 4; *, p < 0.005). (D) GluR2, PSD-95 and RARα expression were not changed by RA treatment (n = 4, p > 0.5). (E) RA-induced GluR1 synthesis in synaptoneurosomes was blocked by cycloheximide and anisomycin, but not actinomycin D (n = 4; *, p < 0.0005). (F) Immunofluorescence staining of hippocampal sections for MAP2 (green) and RARα (red; scale bar for upper panels, 200 µm; for lower panels, 20 µm).
Figure 7
Figure 7. RARα is required for activity blockade- and RA-induced synaptic scaling
(A–C) Effect of RARα knockdown on activity blockade- and RA-induced synaptic scaling in primary cultured hippocampal neurons. (A) Representative traces of mEPSCs recorded from primary cultured neurons of various experimental groups. Scale bars: 20 pA, 20 ms. (B) Inactivity-induced synaptic scaling in dissociated cultures was blocked by RARα shRNA, and the impaired synaptic scaling was rescued by co-expression of a shRNA-resistant mutant RARα (n = 15/group; *, p < 0.05). (C) RA-induced synaptic scaling in dissociated cultures was blocked by RARα shRNA (n = 15/group; *, p < 0.001). (D) Activity blockade-induced synaptic scaling in cultured slices was blocked by RARα shRNA introduced with lentivirus (n = 10/group, p < 1 × 10⁻⁴). (E) Activity blockade induced a significant increase in surface GluR1 but not GluR2 immunoreactivity, which was completely blocked by RARα knockdown (n = 50 dendrites from 18 neurons/group; *, p < 1 × 10⁻¹⁰).
Figure 8
Figure 8. Pharmacological activation of RARα induces synaptic scaling and local GluR1 synthesis
(A–B) Treatment of dissociated hippocampal neurons in culture with the RARα-specific agonist AM580 (1 µM) induced synaptic scaling in neurons from dissociated cultures in a dose-dependent manner (n = 10/group; *, p < 0.05). Scale bars: 20 pA, 20 ms. (C–D) Treatment of cultured hippocampal slices with 1 µM AM580 significantly increased mEPSC amplitude of neurons (n = 16/group, p < 1 × 10⁻⁴). Scale bars: 20 pA, 20 ms. (E–F) AM580 increased GluR1 synthesis in hippocampal synaptoneurosomes (n = 5; *, p < 0.005).
Figure 9
Figure 9. Signaling pathways in homeostatic synaptic plasticity induced by neuronal activity blockade
Previous studies showed that a reduction in neuronal activity (top), which ultimately produces an increase in synaptic strength (bottom), causes changes in intracellular proteins Arc/Arg3.1 and CaM Kinase II (middle; (Shepherd et al., 2006; Thiagarajan et al., 2002), and induces TNFα secretion from glia cells (right; (Stellwagen and Malenka, 2006). We here propose that in addition to these pathways that were previously shown to be required for the particular forms of plasticity studied, activity blockade also induces an increase in RA synthesis, which signals through RARα, directly or indirectly stimulates the insertion of more GluR1-type AMPA-receptors. As a result, even with reduced neuronal activity, the increased strength of individual synapses as a consequence of activation of these pathways leads to the same overall level of synaptic transmission.

Comment in

Similar articles

Cited by

References

    1. Beattie EC, Stellwagen D, Morishita W, Bresnahan JC, Ha BK, Von Zastrow M, Beattie MS, Malenka RC. Control of synaptic strength by glial TNFalpha. Science. 2002;295:2282–2285. - PubMed
    1. Blomhoff R, Green MH, Green JB, Berg T, Norum KR. Vitamin A metabolism: new perspectives on absorption, transport, and storage. Physiol Rev. 1991;71:951–990. - PubMed
    1. Cassiday LA, Maher LJ., 3rd Having it both ways: transcription factors that bind DNA and RNA. Nucleic Acids Res. 2002;30:4118–4126. - PMC - PubMed
    1. Chen N, Napoli JL. All-trans-retinoic acid stimulates translation and induces spine formation in hippocampal neurons through a membrane-associated RARalpha. Faseb J. 2008;22:236–245. - PubMed
    1. Chiang MY, Misner D, Kempermann G, Schikorski T, Giguere V, Sucov HM, Gage FH, Stevens CF, Evans RM. An essential role for retinoid receptors RARbeta and RXRgamma in long-term potentiation and depression. Neuron. 1998;21:1353–1361. - PubMed

Publication types

MeSH terms

LinkOut - more resources