. 2008 Nov;15(11):1160-8.
doi: 10.1038/nsmb.1508. Epub 2008 Oct 26.

The Janus-faced nature of the C(2)B domain is fundamental for synaptotagmin-1 function

Affiliations

The Janus-faced nature of the C(2)B domain is fundamental for synaptotagmin-1 function

Mingshan Xue et al. Nat Struct Mol Biol. 2008 Nov.

Abstract

Synaptotagmin-1 functions as a Ca2+ sensor in neurotransmitter release and was proposed to act on both the synaptic vesicle and plasma membranes through interactions involving the Ca2+ binding top loops of its C(2) domains and the Ca2+-independent bottom face of the C(2)B domain. However, the functional importance of the C(2)B domain bottom face is unclear. We now show that mutating two conserved arginine residues at the C(2)B domain bottom face practically abolishes synchronous release in hippocampal neurons. Reconstitution experiments reveal that Ca2+-synaptotagmin-1 can dramatically stimulate the rate of SNARE-dependent lipid mixing, and that the two-arginine mutation strongly impairs this activity. These results demonstrate that synaptotagmin-1 function depends crucially on the bottom face of the C(2)B domain and strongly support the notion that synaptotagmin-1 triggers membrane fusion and neurotransmitter release by bringing the vesicle and plasma membranes together, much like the SNAREs do but in a Ca2+-dependent manner.


Figures
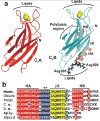
Figure 1
Figure 1
Two highly conserved arginines at the bottom face of the synaptotagmin-1 C2B domain. (a) Ribbon diagrams of the synaptotagmin-1 C2A and C2B domain, illustrating their structural differences. Ca2+ ions are shown as yellow spheres, helices HA and HB of the C2B domain are colored in orange, and R398 and R399 are shown in blue stick models. Strand β8 of the C2B domain is labeled. The lipid-binding sites of both C2 domains are indicated. The binding site for the SNARE complex is tentatively assumed to be in the polybasic region on one side of the C2B domain β-sandwich, but note that this region has also been implicated in other interactions, including lipid binding. (b) Sequence alignment of the C-terminal region of synaptotagmin-1 C2B domains from different species. Conserved residues are colored in red (helices HA and HB), blue (loops) and yellow (strand β8).
Figure 2
Figure 2
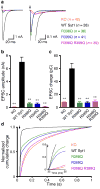
The bottom face of the synaptotagmin-1 C2B domain is critical for fast Ca2+-triggered neurotransmitter release. (a) Average traces of basal evoked EPSCs of hippocampal synaptotagmin-1 KO neurons and KO neurons rescued with WT and mutant synaptotagmin-1 (Syt1) variants. Arrows represent 2–ms somatic depolarizations to 0 mV. Depolarization artifacts and action potentials were blanked. (b,c) Summary data of EPSC amplitude (b) and charge (c). Data are expressed as mean ± s.e.m. ** P < 0.001 as compared to KO neurons rescued by WT synaptotagmin-1. (d) Summary plot of the normalized cumulative EPSC charge in 1 s. The inset shows the same normalized cumulative EPSC charge within the first 50 ms. Numbers of neurons analyzed in (a-d) are indicated in panel (a).
Figure 3
Figure 3
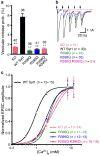
The bottom face of the synaptotagmin-1 C2B domain regulates probability and Ca2+-sensitivity of release. (a) Summary data of vesicular release probability from synaptotagmin-1 KO neurons and KO neurons rescued with WT and mutant synaptotagmin-1 variants. Data are expressed as mean ± s.e.m. ** P < 0.001 as compared to KO neurons rescued by WT synaptotagmin-1. (b) Average traces of 5 consecutive EPSCs evoked at 50 Hz. Arrows represent 2–ms somatic depolarizations to 0 mV. Depolarization artifacts and action potentials were blanked. (c) Apparent Ca2+-sensitivity of evoked release. Normalized amplitudes of synaptic responses were plotted against external Ca2+ concentrations ([Ca2+]e). Data are expressed as mean ± s.e.m. and fitted with standard Hill equation. KO, Kd = 3.0 ± 0.2 mM, WT Syt1, Kd = 0.93 ± 0.01 mM, R398Q, Kd = 2.3 ± 0.1 mM, R399Q, Kd = 2.0 ± 0.1 mM, R398Q,R399Q, Kd = 2.6 ± 0.3 mM. Numbers of neurons analyzed in (a-c) are indicated in the panels.
Figure 4
Figure 4
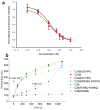
The R398Q,R399Q mutation impairs synaptotagmin-1/membrane interactions. (a) The R398Q,R399Q mutation does not impair the ability of the C2AB fragment to displace a complexin-1 fragment from membrane-anchored SNARE complexes. Supported phospholipid bilayers containing reconstituted SNARE complexes were deposited into microchannels, a rat complexin-1 fragment (residues 26-83) labeled with BODIPY-FL was bound to the SNARE complexes, and displacement of the labeled complexin 1 fragment by increasing concentrations of C2AB fragment (black circles) or C2AB-R398Q,R399Q fragment (red circles) was monitored with a confocal fluorescence microscope as described, . The data were normalized to the background fluorescence. Error bars represent SEMs derived from three separate measurements. Fitting of the data to a dose-response curved yielded an EC50 of 12 nM for both the WT and mutant C2AB fragment, which is comparable to earlier results obtained for WT C2AB fragment. (b) The R398Q,R399Q mutation impairs the vesicle clustering activity of the C2AB fragment. Mixtures of liposomes (100 nm average size) with WT or mutant C2B domain or C2AB fragment were prepared as described, and the change in particle size as a function of time was measured by DLS after addition of 100 μM Ca2+. For the experiment performed with the R398Q,R399Q mutant C2AB fragment, 1 mM Ca2+ was added after 500 s.
Figure 5
Figure 5
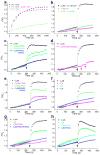
Ca2+ and synaptotagmin-1 induce a drastic increase in the rate of SNARE-mediated lipid mixing that is abolished by the R398Q,R399Q mutation. (a) Lipid mixing between synaptobrevin- and syntaxin-1/SNAP-25-containing proteoliposomes with 1:200 (black) or 1:500 (green) P/L ratios. Equal amounts of the proteoliposomes were mixed, and lipid mixing was detected by monitoring lipid fluorescence dequenching. In all experiments, the syntaxin-1/SNAP-25 liposomes were preincubated with a C-terminal synaptobrevin fragment (residues 49-96). F/F0 represents the fluorescence relative to the starting point. The pink trace shows an experiment performed with a 1:200 P/L ratio in the presence of 1 μM C2AB fragment and 100 μM Ca2+. (b-h) Lipid-mixing assays were performed as in (a) with a 1:500 P/L ratio plus different additions as indicated. Synaptotagmin-1 fragments (1 μM) were added at the beginning of the fusion reaction. In (b), Ca2+ or Mg2+ was added after 250 s of reaction (black arrows) as indicated. In (c-h), 100 μM Ca2+ was added at 250 s (black arrows). In (d), subsequent additions of 200 μM and 1 mM Ca2+ for a reaction with the C2AB-R398Q,R399Q mutant are indicated by pink arrows. WT and mutant C2B domains were purified using our standard protocol, except for one experiment where the WT C2B domain was purified under less stringent conditions [indicated as C2B*; blue triangles in (f)]. Each set of experiments shown in each panel was performed on the same day with the same proteoliposome preparations.
Figure 6
Figure 6
Relative fusion stimulation activities of synaptotagmin-1 fragments. Lipid mixing assays analogous to those shown in Fig. 5 were performed for each synaptotagmin-1 fragment. The increase in F/F0 during the 40 seconds following Ca2+ addition was measured, and the background Ca2+-independent lipid mixing was subtracted by linear extrapolation from the data acquired before Ca2+ addition. The resulting values were normalized to the average F/F0 increase observed for the WT C2AB fragment in parallel experiments with the same proteoliposome concentrations. Error bars show standard deviations from triplicate experiments.
Figure 7
Figure 7
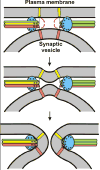
Proposed mode of how the synaptotagmin-1 C2B domain and the SNARE complex cooperate in Ca2+-triggered membrane fusion. The C2B domain is colored in blue, syntaxin in yellow, SNAP-25 in green and synaptobrevin in pink. The C2A domain (not shown for simplicity) is predicted to help in release by binding to one of the membranes, but could have additional roles that remain to be demonstrated. The model predicts that the Ca2+-binding loops at the top of the C2B domain bind to one membrane, the bottom face to the other membrane, and the polybasic region to the SNARE complex (see Fig. 1a for the locations of these structural elements in the C2B domain structure). In principle, the Ca2+-binding loops could act either on the vesicle or the plasma membrane. The + signs illustrate the abundance of positive charges in the C2B domain and the C-terminus of the SNARE complex [see ref. 17]. The red arrows in the top diagram indicate that these positive charges likely help to attract the lipids toward the center, inducing negative curvature on the membranes to initiate fusion.

Similar articles

Cited by

References

    1. Sudhof TC. The synaptic vesicle cycle. Annu Rev Neurosci. 2004;27:509–547. - PubMed
    1. Rizo J, Chen X, Arac D. Unraveling the mechanisms of synaptotagmin and SNARE function in neurotransmitter release. Trends Cell Biol. 2006;16:339–350. - PubMed
    1. Chapman ER. How Does Synaptotagmin Trigger Neurotransmitter Release? Annu Rev Biochem. 2008 - PubMed
    1. Sutton RB, Davletov BA, Berghuis AM, Sudhof TC, Sprang SR. Structure of the first C2 domain of synaptotagmin I: a novel Ca2+/phospholipid-binding fold. Cell. 1995;80:929–938. - PubMed
    1. Shao X, Davletov BA, Sutton RB, Sudhof TC, Rizo J. Bipartite Ca2+-binding motif in C2 domains of synaptotagmin and protein kinase C. Science. 1996;273:248–251. - PubMed

Publication types

MeSH terms

LinkOut - more resources