. 2008 Dec;36(21):6676-87.
doi: 10.1093/nar/gkn647. Epub 2008 Oct 23.

The role of GTP in transient splitting of 70S ribosomes by RRF (ribosome recycling factor) and EF-G (elongation factor G)

Affiliations

The role of GTP in transient splitting of 70S ribosomes by RRF (ribosome recycling factor) and EF-G (elongation factor G)

Go Hirokawa et al. Nucleic Acids Res. 2008 Dec.

Abstract

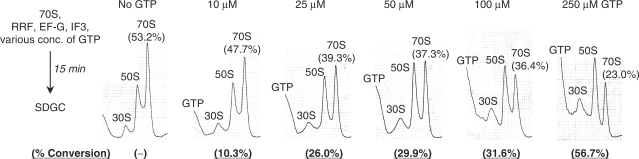
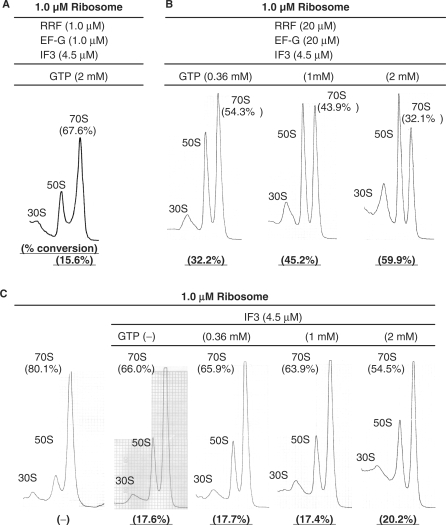
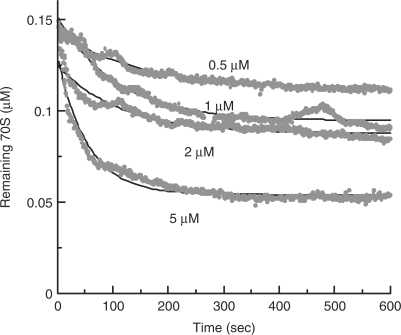
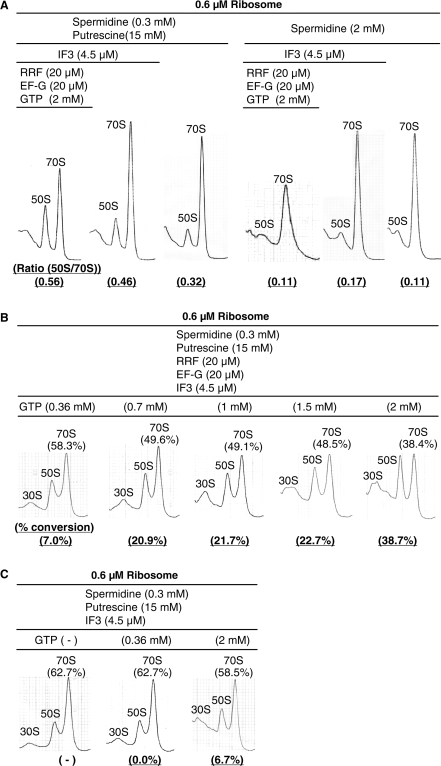
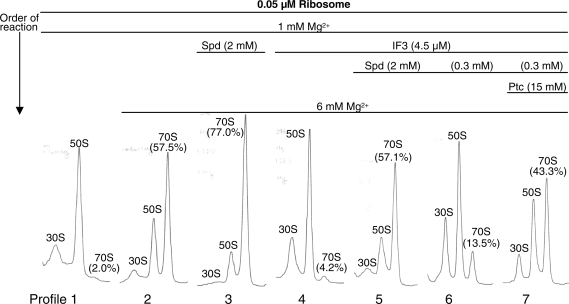
Ribosome recycling factor (RRF), elongation factor G (EF-G) and GTP split 70S ribosomes into subunits. Here, we demonstrated that the splitting was transient and the exhaustion of GTP resulted in re-association of the split subunits into 70S ribosomes unless IF3 (initiation factor 3) was present. However, the splitting was observed with sucrose density gradient centrifugation (SDGC) without IF3 if RRF, EF-G and GTP were present in the SDGC buffer. The splitting of 70S ribosomes causes the decrease of light scattering by ribosomes. Kinetic constants obtained from the light scattering studies are sufficient to account for the splitting of 70S ribosomes by RRF and EF-G/GTP during the lag phase for activation of ribosomes for the log phase. As the amount of 70S ribosomes increased, more RRF, EF-G and GTP were necessary to split 70S ribosomes. In the presence of a physiological amount of polyamines, GTP and factors, even 0.6 microM 70S ribosomes (12 times higher than the 70S ribosomes for routine assay) were split. Spermidine (2 mM) completely inhibited anti-association activity of IF3, and the RRF/EF-G/GTP-dependent splitting of 70S ribosomes.


Figures

Figure 1.
Figure 1.
Effect of various concentrations of GTP on the extent of ribosomal splitting by RRF, EF-G and IF3. The 70S ribosome preparation (0.05 µM) was incubated with RRF (5 µM), EF-G (5 µM) and native IF3 (1 µM) with various concentrations of GTP at 30°C for 15 min, and the ribosomal sedimentation patterns were analyzed as described in Materials and methods section. Sedimentation was from left to right. The numbers above the 70S ribosome peaks indicate the percentages of 70S ribosomes of the total quantity of ribosomes. The numbers at the bottom of each sedimentation pattern indicate the percentage of conversions of 70S ribosomes by RRF, EF-G and IF3 calculated using the following equation: % conversion = 100 × (53.2 – percentage of 70S ribosomes indicated above the peak)/53.2; 53.2 represents the percentage of 70S ribosomes without GTP (left profile).
Figure 2.
Figure 2.
Upon GTP exhaustion, ribosomal subunits re-associated: evidence for transient nature of the splitting of 70S ribosomes by RRF and EF-G. The numbers above the profiles are percentages of 70S ribosomes as in Figure 1. (A) Fifty micromolar GTP were exhausted within 10 minutes. Left panel: the 70S ribosome preparation (0.05 µM) was incubated for 5 min with RRF (5 µM), EF-G (5 µM), GTP (50 µM) and native IF3 (1 µM) simultaneously. Right panel: the same ribosomes (0.05 µM) were incubated for 10 min with RRF (5 µM), EF-G (5 µM) and GTP (50 µM) without IF3, and then native IF3 (1 µM) was added and incubated for an additional 5 min. Note that there was no effect of RRF and EF-G due to the exhaustion of GTP during the 10-min incubation without IF3 (54.9% of 70S ribosomes were present, which is the same amount as with IF3 alone. See Figure 2B, right profile). (B) Control of (A). Left panel: the 70S ribosome preparation (0.05 µM) alone was incubated for 5 min. Right panel: the 70S ribosome preparation was incubated for 5 min with native IF3 (1 µM). (C) Time course of 70S splitting by RRF and EF-G with 50 µM GTP. The 70S ribosome preparation (0.05 µM) was incubated for various periods (0 to 10 min) with RRF (5 µM), EF-G (5 µM) and GTP (50 µM), then with native IF3 (1 µM) and fusidic acid (FA, 200 µM) for an additional 5 min. Ribosomal sedimentation patterns were analyzed as in Figure 1. Next to the sedimentation patterns, experimental designs are described in a schematic style. The t-values in parenthesis above each profile indicate the time periods for the incubation with RRF, EF-G and GTP without IF3. % conversion = 100 × (54.9 – percentage of 70S ribosomes indicated above the peak)/54.9; 54.9 represents percentage of 70S ribosomes with IF3 only (Figure 2B, right profile).
Figure 3.
Figure 3.
Supplying GTP and factors during SDGC revealed the transient splitting of 70S ribosomes by SDGC. (A) The 70S ribosome preparation (0.05 µM) was incubated with RRF (1 µM), EF-G (1 µM) and GTP (0.36 mM) ‘without’ IF3 at 30°C for 10 min and the sedimentation behavior of ribosomes were analyzed with regular SDGC as described in Materials and methods section. Sedimentation was from left to right. (B) The splitting reaction and the SDGC analysis conditions were the same as (A), except that the SDGC buffer contained RRF (1 µM), EF-G (1 µM) and GTP (0.36 mM) to keep the separated units apart during the centrifugation. The background absorbance was about 4.4 A260 units mostly due to added GTP in the SDGC buffer.
Figure 4.
Figure 4.
Decrease of the extent of RRF/EF-G-dependent splitting due to increase of the 70S ribosomes. (A) Equilibrium between the 70S ribosomes and dissociated subunits. K, k1 and k1 are equilibrium, forward rate, and reverse rate constants, respectively. [70S], [50S] and [30S] indicate the concentrations of the ribosomes and subunits, respectively. When [70S] increases, the subunits concentrations increase accordingly. The numerator, which is the multiple of both subunits concentrations, increases more than [70S] (denominator), thus driving the equilibrium to the left. IF3 binds to the 30S subunit and prevents reassociation. (BF) Ribosomes as indicated were incubated alone or with RRF (1 µM), EF-G (1 µM), His-IF3 (4 µM) and GTP (0.36 mM) in buffer R at 30°C for 20 min. Ribosomal sedimentation patterns were analyzed as described in Materials and methods section. The percentages of 70S ribosomes of the total ribosomes are indicated above each profile. The 70S ribosomes split are represented by % conversion = 100 × (percentage of 70S alone – percentage of 70S with factors)/percentage of 70S alone. The % conversions are indicated below the 70S peaks. It was noted that percentage of 70S ribosomes [left profiles of (B) through (F)] increased as the concentration of 70S ribosomes increased.
Figure 5.
Figure 5.
Decrease of the RRF/EF-G-dependent splitting due to the increase of 70S ribosomes was overcome by the increase of factors and GTP. The numbers below and above the profiles are conversions and percentages of 70S ribosomes, respectively. (A) The increase of GTP alone did not overcome the effect of increased 70S ribosomes (1 µM). (B) The increase of both GTP and factors overcame the effect of increased ribosomes. The reaction conditions were identical to (A) except that the amounts of factors were increased 20-fold. (C) Controls of (A) and (B). It shows the effect of IF3 and various concentrations of GTP on 70S ribosomes. 70S ribosome split was represented by % conversion = 100 × (80.1 – percentage of 70S with factors)/80.1; 80.1 represents percentage of 70S ribosomes alone.
Figure 6.
Figure 6.
Kinetic studies on the splitting of 70S ribosomes by EF-G and RRF without IF3: decrease of ribosomal light scattering due to the splitting of the ribosomes. The 70S ribosome preparation (0.15 µM) was incubated with 5 µM RRF, 0.5 mM GTP and various concentrations of EF-G (as indicated) as described in Materials and methods section. The change of the light scattering relative to the initial value at 20 s was measured against the incubation time and expressed as the amount of remaining 70S ribosomes in micromolars. Data were fit to single- (solid lines) exponential decay curves. The control value without EF-G gave about 10% of 70S ribosomes dissociation (0.135 µM remaining 70S ribosomes) in 6 min by RRF alone (11) under similar conditions.
Figure 7.
Figure 7.
Splitting of 70S ribosomes in the presence of polyamines. (A) Ribosomes were split in physiological concentrations of polyamines, but not in 2 mM spermidine (Spd). The 70S ribosome preparation (0.6 µM) was incubated in the presence of polyamines and sedimented through the sucrose gradient containing polyamines as indicated in the figure. The 30S peak was not clearly visible due to the presence of polyamines in the gradient. The ratio of 50S subunits to 70S ribosomes are shown below the 50S peaks. (B) The effect of various concentrations of GTP on the splitting of 70S ribosomes in the presence of physiological concentration of polyamines. Ribosomes were incubated, as in (A), in buffer containing physiological concentrations of polyamines, GTP, RRF and EF-G and sedimented through sucrose gradient in buffer R containing no polyamine. (C) Control of (B). The effect of IF3 without RRF/EF-G. The numbers below and above the profiles in (B) and (C) are conversion and percentages of 70S ribosomes, respectively. The 70S ribosome split was represented by % conversion = 100 × (62.7 – percentage of 70S in P buffer with factors and GTP)/62.7; 62.7 represents percentage of 70S ribosomes in P buffer with 4.5 µM IF3 (left profile).
Figure 8.
Figure 8.
Spermidine (2 mM) inhibited anti-association activity of IF3. The 70S ribosome preparation was split into subunits in the low magnesium buffer (profile 1). Subunits thus prepared were mixed with Mg-acetate to the final concentration of 6 mM Mg2+ and incubated in the absence (profile 2) or presence (profile 4) of IF3. Profile 3 indicates subunits exposed to 2 mM Spd in addition to 6 mM Mg2+. Profile 5 shows the ribosomes after the subunits were exposed to IF3 followed by the addition of 2 mM spermidine and Mg2+. Profiles 6 and 7 are identical experiments to profile 5 except that the polyamine concentrations were changed as indicated. Ribosomal sedimentation profiles were analyzed as described in Materials and methods section. The percentages of 70S ribosomes are indicated above the 70S peak in each profile.

Similar articles

Cited by

References

    1. Weaver RF. Molecular biology. 3rd edn. New York: McGraw Hill; 2005.
    1. Capecchi MR. Polypeptide chain termination in vitro: isolation of a release factor. Proc. Natl Acad. Sci. USA. 1967;58:1144–1151. - PMC - PubMed
    1. Scolnick E, Tompkins R, Caskey T, Nirenberg M. Release factors differing in specificity for terminator codons. Proc. Natl Acad. Sci. USA. 1968;61:768–774. - PMC - PubMed
    1. Frolova L, Goff XL, Rasmussen HH, Cheperegin S, Drugeon G, Kress M, Arman I, Haenni AL, Celis JE, Philippe M, et al. A highly conserved eukaryotic protein family possessing properties of polypeptide chain release factor. Nature. 1994;372:701–703. - PubMed
    1. Capecchi MR, Klein HA. Characterization of three proteins involved in polypeptide chain termination. Cold Spring Harb. Symp. Quant. Biol. 1969;34:469–477. - PubMed

Publication types

MeSH terms