Correlated evolution of interacting proteins: looking behind the mirrortree
- PMID: 18930732
- PMCID: PMC2678019
- DOI: 10.1016/j.jmb.2008.09.078
Correlated evolution of interacting proteins: looking behind the mirrortree
Abstract
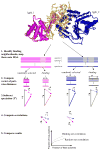
It has been observed that the evolutionary distances of interacting proteins often display a higher level of similarity than those of noninteracting proteins. This finding indicates that interacting proteins are subject to common evolutionary constraints and constitutes the basis of a method to predict protein interactions known as mirrortree. It has been difficult, however, to identify the direct cause of the observed similarities between evolutionary trees. One possible explanation is the existence of compensatory mutations between partners' binding sites to maintain proper binding. This explanation, though, has been recently challenged, and it has been suggested that the signal of correlated evolution uncovered by the mirrortree method is unrelated to any correlated evolution between binding sites. We examine the contribution of binding sites to the correlation between evolutionary trees of interacting domains. We show that binding neighborhoods of interacting proteins have, on average, higher coevolutionary signal compared with the regions outside binding sites; however, when the binding neighborhood is removed, the remaining domain sequence still contains some coevolutionary signal. In conclusion, the correlation between evolutionary trees of interacting domains cannot exclusively be attributed to the correlated evolution of the binding sites or to common evolutionary pressure exerted on the whole protein domain sequence, each of which contributes to the signal measured by the mirrortree approach.
Figures


Similar articles
-
Prediction of protein interaction based on similarity of phylogenetic trees.Methods Mol Biol. 2008;484:523-35. doi: 10.1007/978-1-59745-398-1_31. Methods Mol Biol. 2008. PMID: 18592199
-
Predicting protein-protein interaction by the mirrortree method: possibilities and limitations.PLoS One. 2013 Dec 13;8(12):e81100. doi: 10.1371/journal.pone.0081100. eCollection 2013. PLoS One. 2013. PMID: 24349035 Free PMC article.
-
Predicting protein domain interactions from coevolution of conserved regions.Proteins. 2007 Jun 1;67(4):811-20. doi: 10.1002/prot.21347. Proteins. 2007. PMID: 17357158
-
Protein co-evolution, co-adaptation and interactions.EMBO J. 2008 Oct 22;27(20):2648-55. doi: 10.1038/emboj.2008.189. Epub 2008 Sep 25. EMBO J. 2008. PMID: 18818697 Free PMC article. Review.
-
An integrated view of molecular coevolution in protein-protein interactions.Mol Biol Evol. 2010 Nov;27(11):2567-75. doi: 10.1093/molbev/msq144. Epub 2010 Jun 14. Mol Biol Evol. 2010. PMID: 20551042 Review.
Cited by
-
Evolutionary rate covariation identifies new members of a protein network required for Drosophila melanogaster female post-mating responses.PLoS Genet. 2014 Jan;10(1):e1004108. doi: 10.1371/journal.pgen.1004108. Epub 2014 Jan 16. PLoS Genet. 2014. PMID: 24453993 Free PMC article.
-
Covariation of branch lengths in phylogenies of functionally related genes.PLoS One. 2009 Dec 29;4(12):e8487. doi: 10.1371/journal.pone.0008487. PLoS One. 2009. PMID: 20041191 Free PMC article.
-
The role of insulin C-peptide in the coevolution analyses of the insulin signaling pathway: a hint for its functions.PLoS One. 2012;7(12):e52847. doi: 10.1371/journal.pone.0052847. Epub 2012 Dec 27. PLoS One. 2012. PMID: 23300796 Free PMC article.
-
Emerging methods in protein co-evolution.Nat Rev Genet. 2013 Apr;14(4):249-61. doi: 10.1038/nrg3414. Epub 2013 Mar 5. Nat Rev Genet. 2013. PMID: 23458856 Review.
-
Calculation of evolutionary correlation between individual genes and full-length genome: a method useful for choosing phylogenetic markers for molecular epidemiology.PLoS One. 2013 Dec 3;8(12):e81106. doi: 10.1371/journal.pone.0081106. eCollection 2013. PLoS One. 2013. PMID: 24312527 Free PMC article.
References
-
- Goh CS, Bogan AA, Joachimiak M, Walther D, Cohen FE. Co-evolution of proteins with their interaction partners. J Mol Biol. 2000;299:283–93. - PubMed
-
- Pazos F, Helmer-Citterich M, Ausiello G, Valencia A. Correlated mutations contain information about protein-protein interaction. J Mol Biol. 1997;271:511–23. - PubMed
-
- Pazos F, Valencia A. Similarity of phylogenetic trees as indicator of protein-protein interaction. Protein Eng. 2001;14:609–14. - PubMed
-
- Goh CS, Cohen FE. Co-evolutionary analysis reveals insights into protein-protein interactions. J Mol Biol. 2002;324:177–92. - PubMed
Publication types
MeSH terms
Grants and funding
LinkOut - more resources
Full Text Sources
Other Literature Sources

