. 2008 Nov 28;283(48):33069-79.
doi: 10.1074/jbc.M802209200. Epub 2008 Oct 6.

Tumor necrosis factor-alpha potentiates intraneuronal Ca2+ signaling via regulation of the inositol 1,4,5-trisphosphate receptor

Affiliations

Tumor necrosis factor-alpha potentiates intraneuronal Ca2+ signaling via regulation of the inositol 1,4,5-trisphosphate receptor

Keigan M Park et al. J Biol Chem. .

Abstract

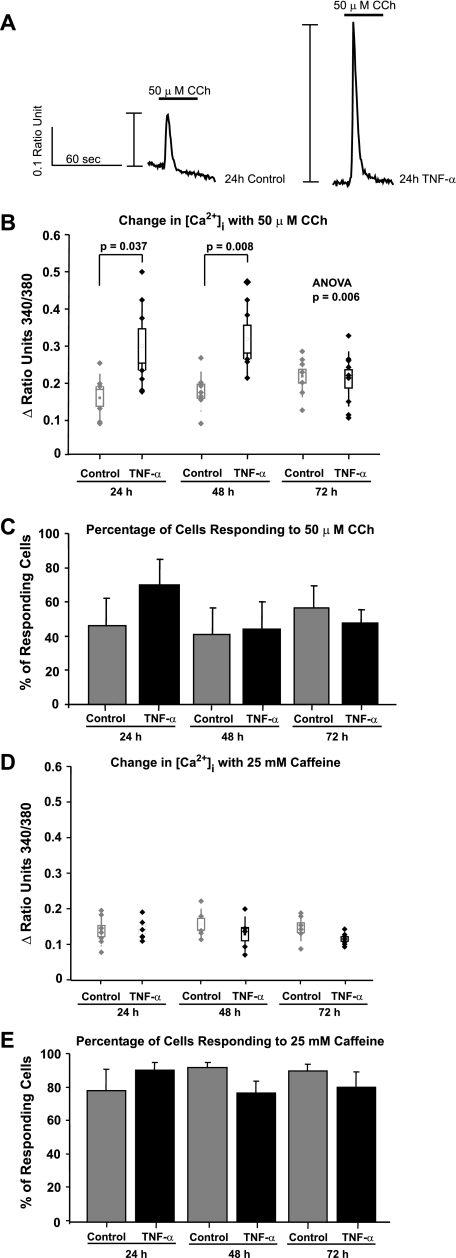
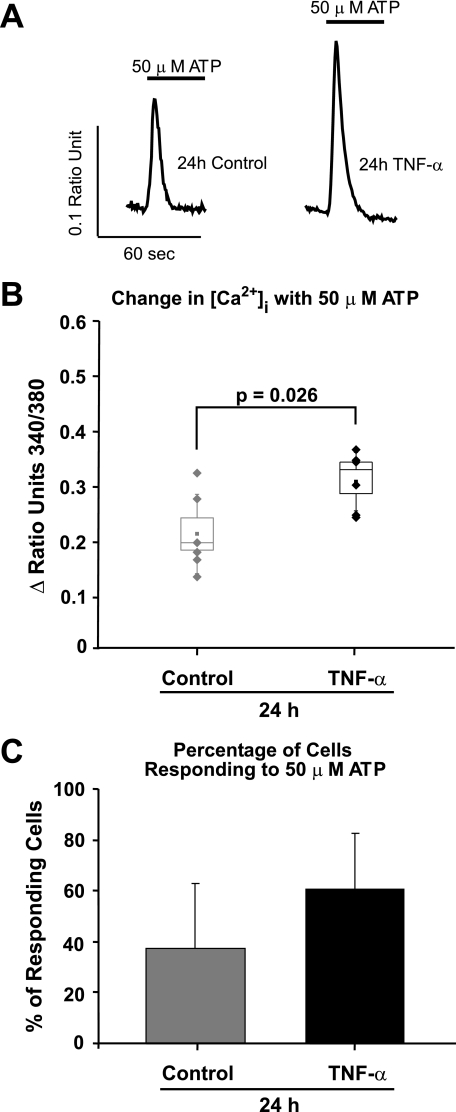
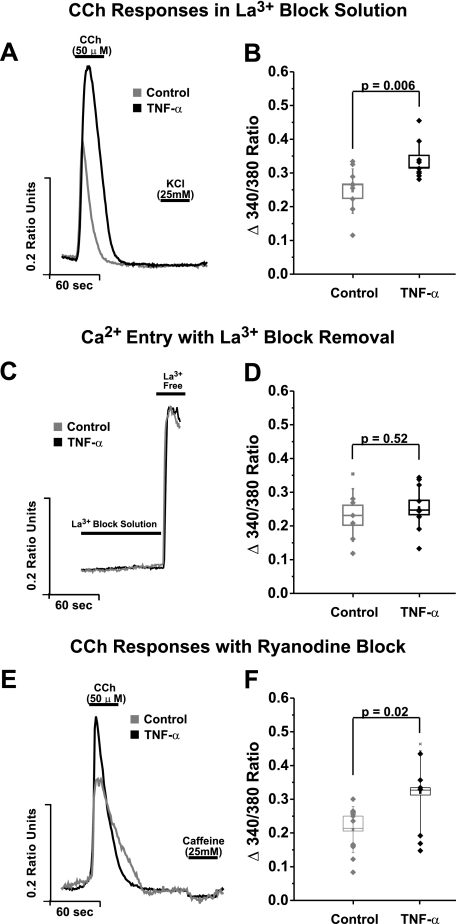
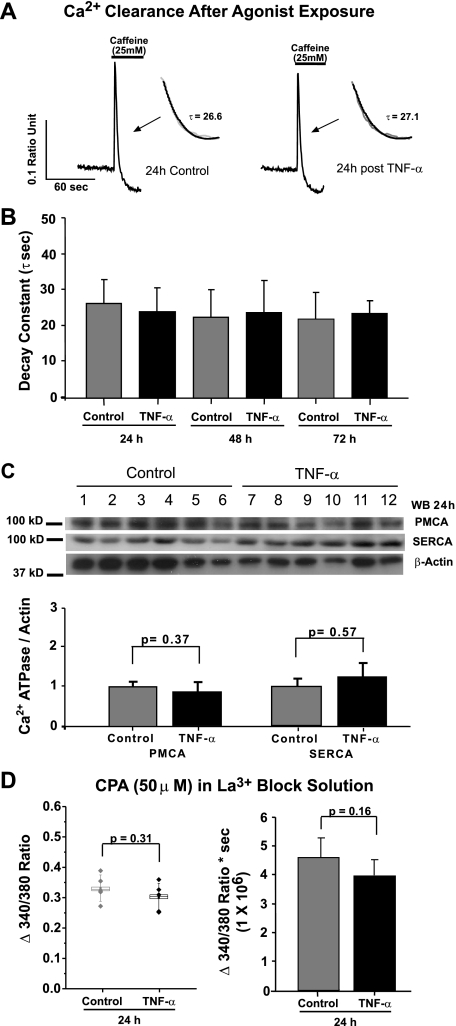
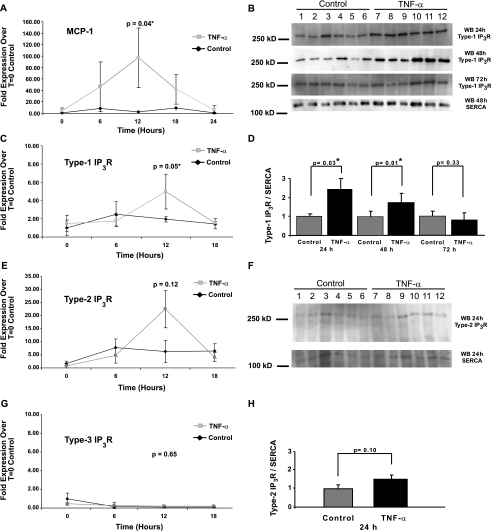
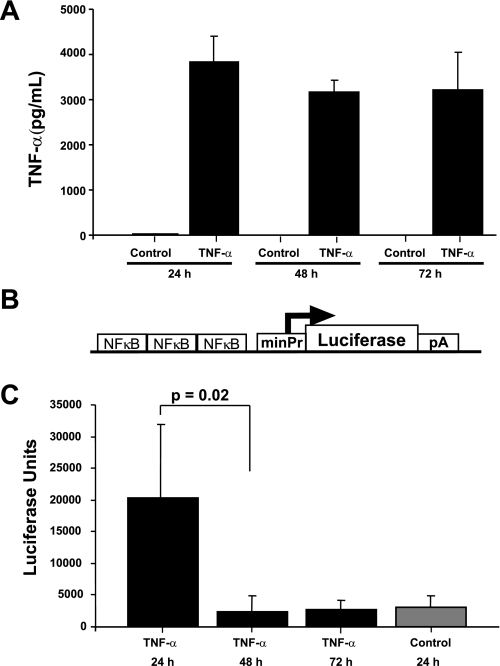
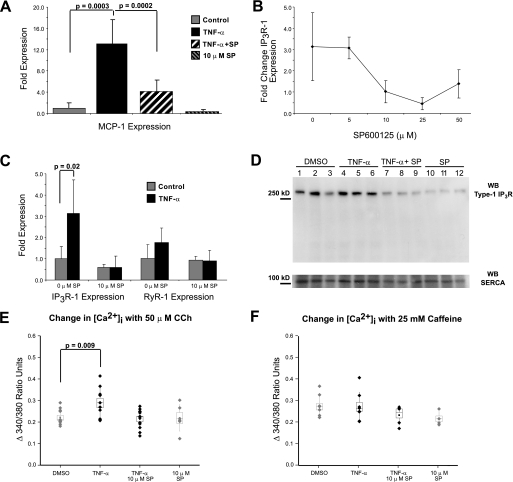
Inflammatory events have long been implicated in initiating and/or propagating the pathophysiology associated with a number of neurological diseases. In addition, defects in Ca2+-handling processes, which shape membrane potential, influence gene transcription, and affect neuronal spiking patterns, have also been implicated in disease progression and cognitive decline. The mechanisms underlying the purported interplay that exists between neuroinflammation and Ca2+ homeostasis have yet to be defined. Herein, we describe a novel neuron-intrinsic pathway in which the expression of the type-1 inositol 1,4,5-trisphosphate receptor is regulated by the potent pro-inflammatory cytokine tumor necrosis factor-alpha. Exposure of primary murine neurons to tumor necrosis factor-alpha resulted in significant enhancement of Ca2+ signals downstream of muscarinic and purinergic stimulation. An increase in type-1 inositol 1,4,5-trisphosphate receptor mRNA and protein steady-state levels following cytokine exposure positively correlated with this alteration in Ca2+ homeostasis. Modulation of Ca2+ responses arising from this receptor subtype and its downstream effectors may exact significant consequences on neuronal function and could underlie the compromise in neuronal activity observed in the setting of chronic neuroinflammation, such as that associated with Parkinson disease and Alzheimer disease.


Figures

FIGURE 1.
FIGURE 1.
Effect of murine TNF-α on neuronal muscarinic and RyR signaling. 12- to 14-Day in vitro primary C57Bl/6 neuronal cultures were processed for Ca2+-imaging experiments. Cytosolic Ca2+ signals (total area excluding nucleus) following CCh exposure were measured in neurons after application of 100 ng/ml murine TNF-α or PBS for 24, 48, and 72 h. A, representative traces depicting the CCh response (brackets represent the change in 340/380 ratio) in single neurons after 24-h treatment with PBS or TNF-α. B, peak CCh responses were averaged for each coverslip and are shown as a diamond in the box plots. C, the percentage of neurons with a response greater than two standard deviations over background during the addition of 50 μm CCh are shown for each treatment group. D and E, 25 mm caffeine was perfused over neuronal monolayers to elicit a RyR-mediated Ca2+ response. D, average responses from each coverslip are again plotted in box plot form, and the percentage of cells that responded to 25 mm caffeine (E) is also shown for 24, 48, and 72 h of PBS or TNF-α treatment. Box plot parameters are as follows: diamonds represent the mean peak response from ∼8 neurons per coverslip, small boxes are the mean of the coverslip averages, large boxes indicate one standard error of the mean, and the whiskers indicate one standard deviation of the mean. p values were obtained from two-tailed Student's t testing and analysis of variance analysis was performed in relation to the TNF-α variable.
FIGURE 2.
FIGURE 2.
Effect of TNF-α on purinergic Ca2+ signaling. Primary neurons were treated with 100 ng/ml TNF-α for 24 h and subsequently loaded with the calcium imaging dye, Fura2-AM. Emitted fluorescence from alternating 340/380 nm excitation was monitored after exposure to 50μm ATP in the presence of a La3+ block solution to eliminate Ca2+ influx. A, representative traces depicting the ATP response are shown for both a control and cytokine treated neuron. B, average peak responses from six coverslips (n) for each condition were analyzed and are shown in box plot format (for parameters see Fig. 1). C, the percentage of neurons that responded (change in 340/380 ratio of >2 S.D. from the baseline) in response to perfusion with ATP addition is plotted.
FIGURE 3.
FIGURE 3.
Elimination of Ca2+ influx and functional RyR Coupling. Ca2+-imaging experiments were performed on 24-h TNF-α-treated C57BL/6 primary neurons in reduced Ca2+-La3+-containing perfusion buffer (0.5 mm Ca2+, 300 μm La3+) and in the presence of 100 μm RyR to elucidate the components of the muscarinic cascade affected by cytokine treatment. A and B, Ca2+ entry was inhibited using a reduced Ca2+-La3+-containing external perfusion solution, and CCh signals were again assayed. A, sample traces are shown to demonstrate the solution had no effect on the CCh-mediated signals but completely blocked KCl-induced Ca2+ entry. B, CCh responses were averaged for each coverslip and are shown as a diamond in the box plots (for parameters see Fig. 1). C and D, Ca2+ entry was also directly measured by the reperfusion of the neurons with a La3+ free (normal) physiological saline solution. C, representative traces from one control and one TNF-α-treated neuron are shown to demonstrate the lack of effect on the peak and kinetics of Ca2+ entry. D, peak values for Ca2+ entry are shown in box plot format. E and F, the possibility of enhanced RyR coupling leading to enhanced muscarinic signals through Ca2+-induced Ca2+ release was tested directly by inhibiting the RyR with 100 μm ryanodine. E, sample traces are shown depicting the ability of the drug treatment to completely inhibit caffeine-induced Ca2+ signals, whereas the CCh signal was preserved. F, average CCh signals from nine control and nine 24-h TNF-α-treated coverslips are shown in box plot format.
FIGURE 4.
FIGURE 4.
Ca2+ clearance and ER Ca2+ homeostasis. Primary neurons were analyzed for the possible contribution of decreased Ca2+ clearance or enhanced ER Ca2+ stores on the elevated Gq-coupled Ca2+ signals. A and B, the clearance of Ca2+ from the soma was measured by fitting the decay of caffeine-induced Ca2+ transients to a single exponential. G, arrows indicate the decay of the Ca2+ signals fit by a single exponential function, which is illustrated in the inset. H, the average time constants obtained by the mathematical fitting of the decrease in 340/380 ratio (Ca2+ clearance) after each treatment over time are shown. C, total neuronal homogenates were subjected to SDS-PAGE and Western blotting for SERCA, PMCA, and β-actin. Optical density ratios of each Ca2+ ATPase versus β-actin are shown for both control and TNF-α-treated cultures. D, ER Ca2+ levels were analyzed using the reversible SERCA inhibitor CPA in the presence of La3+ block. CPA induced a transient increase in [Ca2+]c that was analyzed for both peak height (left panel) and area of the response (right panel). p values were obtained from two-tailed Student's t testing.
FIGURE 5.
FIGURE 5.
IP3R mRNA and protein levels following treatment with murine TNF-α. 11-Day in vitro primary neuronal cultures were treated with 100 ng/ml mouse recombinant TNF-α. RNA was extracted from 12 wells (n = 6) containing 6 × 10⁵ cells per two wells using the TRIzol phenol/chloroform method, and 2μg was archived as cDNA. A, a quantitative real-time RT-PCR primer/probe set specific for monocyte chemoattractant protein-1 (MCP-1) was used as a positive TNF-α target control. C, E, and G, the steady-state levels of the type-1/2/3 IP3R transcripts over an 18-h period were observed by independent primer probe sets and normalized to SERCA mRNA at each time point. B, protein was extracted from 24-, 48-, and 72-h TNF-α- and control-treated neurons and enriched for the ER membrane. 25 μg of total protein was submitted to SDS-PAGE and type-1 IP3R, and SERCA as a loading control, protein levels were monitored by Western blotting. Band intensities were quantified using Labworks software and presented as optical density ratios of IP3R to SERCA for control (D, lanes 1–6) and TNF-α-treated groups (D, lanes 7–12). F and H, 24-h protein levels were also examined for the type-2 IP3R in a similar fashion. p values were obtained from two-tailed Student's t testing. *, indicates a p value of <0.05.
FIGURE 6.
FIGURE 6.
TNF-α activity in primary neuronal culture supernatants. TNF-α peptide levels at 24, 48, and 72 h following addition to primary neuronal cultures were measured by enzyme-linked immunosorbent assay (A), and the ability of this cytokine to activate NFκB signaling following prolonged culture incubation times was assessed using an in vitro bioactivity assay. B, functional activity of TNF-α in the culture medium from treated neuronal cultures was measured by adding aliquots of these media samples to BHK cells transiently transfected with a plasmid construct harboring a tandem NFκB binding element array and minimal promoter driving the expression of the firefly luciferase gene. C, luciferase activity was measured using a luminometer. Error bars indicate one standard deviation from the mean.
FIGURE 7.
FIGURE 7.
Inhibition of JNK suppresses the observed TNF-α-mediated enhancement of muscarinic signals. C57Bl/6-derived cortical neurons were treated with the JNK inhibitor, SP600125, for 1 h before treatment with 100 ng/ml murine recombinant TNF-α. qRT-PCR was performed on extracted mRNA after 24 h of TNF-α treatment. A, the ability of the inhibitor to block JNK signaling was tested by assaying its ability to block the increase in MCP-1 mRNA previously observed with TNF-α treatment. B, various concentrations of the inhibitor were used to determine its ability to inhibit the observed increase in type-1 IP3R mRNA (n = 6 independent samples at each concentration). The enhancement of type-1 IP3R mRNA with TNF-α treatment in the presence of SP600125 versus the mRNA level with inhibitor alone is plotted. Error bars indicate the standard deviation of each TNF-α-induced increase in receptor transcript versus the average of six control cultures. A specific subset of the data in B is shown in C comparing the steady-state mRNA levels of the type-1 IP3R, and the type-1 RyR as a control, with TNF-α treatment to cultures exposed to 10μm inhibitor. D, 10μm SP600125 was also tested by Western blotting for its ability inhibit the enhanced type-1 IP3R protein levels observed with 24-h TNF-α treatment. E, the JNK inhibitor was then assayed for its ability to inhibit the TNF-α-mediated enhancement in muscarinic Ca2+ signaling at 24 h. Experiments were performed as described in Fig. 1, but with the replacement of PBS with 0.1% DMSO in the control condition. F, Ca2+ signals due to the addition of 25 mm caffeine were also tested in the presence of TNF-α and JNK inhibitor to monitor the effects of SP600125 on other ER-derived Ca2+ signals.

Similar articles

Cited by

References

    1. McGeer, E. G., Klegeris, A., and McGeer, P. L. (2005) Neurobiol. Aging. 26 Suppl. 1, 94–97 - PubMed
    1. Carswell, E. A., Old, L. J., Kassel, R. L., Green, S., Fiore, N., and Williamson, B. (1975) Proc. Natl. Acad. Sci. U. S. A. 72 3666–3670 - PMC - PubMed
    1. Ortaldo, J. R., Mason, L. H., Mathieson, B. J., Liang, S. M., Flick, D. A., and Herberman, R. B. (1986) Nature 321 700–702 - PubMed
    1. Laster, S. M., Wood, J. G., and Gooding, L. R. (1988) J. Immunol. 141 2629–2634 - PubMed
    1. Hanisch, U. K. (2002) Glia 40 140–155 - PubMed

Publication types

MeSH terms