Shape complementarity of protein-protein complexes at multiple resolutions
- PMID: 18837463
- PMCID: PMC2928789
- DOI: 10.1002/prot.22256
Shape complementarity of protein-protein complexes at multiple resolutions
Abstract
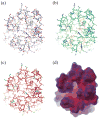
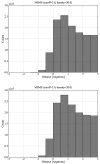
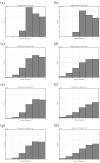
Biological complexes typically exhibit intermolecular interfaces of high shape complementarity. Many computational docking approaches use this surface complementarity as a guide in the search for predicting the structures of protein-protein complexes. Proteins often undergo conformational changes to create a highly complementary interface when associating. These conformational changes are a major cause of failure for automated docking procedures when predicting binding modes between proteins using their unbound conformations. Low resolution surfaces in which high frequency geometric details are omitted have been used to address this problem. These smoothed, or blurred, surfaces are expected to minimize the differences between free and bound structures, especially those that are due to side chain conformations or small backbone deviations. Despite the fact that this approach has been used in many docking protocols, there has yet to be a systematic study of the effects of such surface smoothing on the shape complementarity of the resulting interfaces. Here we investigate this question by computing shape complementarity of a set of 66 protein-protein complexes represented by multiresolution blurred surfaces. Complexed and unbound structures are available for these protein-protein complexes. They are a subset of complexes from a nonredundant docking benchmark selected for rigidity (i.e. the proteins undergo limited conformational changes between their bound and unbound states). In this work, we construct the surfaces by isocontouring a density map obtained by accumulating the densities of Gaussian functions placed at all atom centers of the molecule. The smoothness or resolution is specified by a Gaussian fall-off coefficient, termed "blobbyness." Shape complementarity is quantified using a histogram of the shortest distances between two proteins' surface mesh vertices for both the crystallographic complexes and the complexes built using the protein structures in their unbound conformation. The histograms calculated for the bound complex structures demonstrate that medium resolution smoothing (blobbyness = -0.9) can reproduce about 88% of the shape complementarity of atomic resolution surfaces. Complexes formed from the free component structures show a partial loss of shape complementarity (more overlaps and gaps) with the atomic resolution surfaces. For surfaces smoothed to low resolution (blobbyness = -0.3), we find more consistency of shape complementarity between the complexed and free cases. To further reduce bad contacts without significantly impacting the good contacts we introduce another blurred surface, in which the Gaussian densities of flexible atoms are reduced. From these results we discuss the use of shape complementarity in protein-protein docking.
Figures


Similar articles
-
Protein-protein docking using region-based 3D Zernike descriptors.BMC Bioinformatics. 2009 Dec 9;10:407. doi: 10.1186/1471-2105-10-407. BMC Bioinformatics. 2009. PMID: 20003235 Free PMC article.
-
Examination of shape complementarity in docking of unbound proteins.Proteins. 1999 Aug 15;36(3):307-17. Proteins. 1999. PMID: 10409824
-
Shape complementarity and hydrogen bond preferences in protein-protein interfaces: implications for antibody modeling and protein-protein docking.Bioinformatics. 2016 Aug 15;32(16):2451-6. doi: 10.1093/bioinformatics/btw197. Epub 2016 Apr 19. Bioinformatics. 2016. PMID: 27153634 Free PMC article.
-
Flexible protein-protein docking.Curr Opin Struct Biol. 2006 Apr;16(2):194-200. doi: 10.1016/j.sbi.2006.02.002. Epub 2006 Feb 17. Curr Opin Struct Biol. 2006. PMID: 16488145 Review.
-
Computational analyses of the surface properties of protein-protein interfaces.Acta Crystallogr D Biol Crystallogr. 2007 Jan;63(Pt 1):50-7. doi: 10.1107/S0907444906046762. Epub 2006 Dec 13. Acta Crystallogr D Biol Crystallogr. 2007. PMID: 17164526 Free PMC article. Review.
Cited by
-
Protein-protein alternative binding modes do not overlap.Protein Sci. 2013 Aug;22(8):1141-5. doi: 10.1002/pro.2295. Epub 2013 Jul 3. Protein Sci. 2013. PMID: 23775945 Free PMC article.
-
Protein-protein docking: from interaction to interactome.Biophys J. 2014 Oct 21;107(8):1785-1793. doi: 10.1016/j.bpj.2014.08.033. Biophys J. 2014. PMID: 25418159 Free PMC article. Review.
-
2D Zernike polynomial expansion: Finding the protein-protein binding regions.Comput Struct Biotechnol J. 2020 Dec 4;19:29-36. doi: 10.1016/j.csbj.2020.11.051. eCollection 2021. Comput Struct Biotechnol J. 2020. PMID: 33363707 Free PMC article.
-
EnCPdock: a web-interface for direct conjoint comparative analyses of complementarity and binding energetics in inter-protein associations.J Mol Model. 2023 Jul 10;29(8):239. doi: 10.1007/s00894-023-05626-0. J Mol Model. 2023. PMID: 37423912
-
Rotation of artificial rotor axles in rotary molecular motors.Proc Natl Acad Sci U S A. 2016 Oct 4;113(40):11214-11219. doi: 10.1073/pnas.1605640113. Epub 2016 Sep 19. Proc Natl Acad Sci U S A. 2016. PMID: 27647891 Free PMC article.
References
-
- Chen R, Weng Z. Docking unbound proteins using shape complementarity, desolvation, and electrostatics. Proteins. 2002;47(3):281–294. - PubMed
-
- Chen R, Weng Z. A novel shape complementarity scoring function for protein-protein docking. Proteins. 2003;51(3):397–408. - PubMed
-
- Fischer D, Lin SL, Wolfson HL, Nussinov R. A geometry-based suite of molecular docking processes. J Mol Biol. 1995;248(2):459–477. - PubMed
-
- Gabb HA, Jackson RM, Sternberg MJ. Modelling protein docking using shape complementarity, electrostatics and biochemical information. J Mol Biol. 1997;272(1):106–120. - PubMed
-
- Gardiner EJ, Willett P, Artymiuk PJ. Protein docking using a genetic algorithm. Proteins. 2001;44(1):44–56. - PubMed
Publication types
MeSH terms
Substances
Grants and funding
LinkOut - more resources
Full Text Sources
Research Materials

