

A new scoring system in Cystic Fibrosis: statistical tools for database analysis - a preliminary report
- PMID: 18834547
- PMCID: PMC2580762
- DOI: 10.1186/1472-6947-8-44
A new scoring system in Cystic Fibrosis: statistical tools for database analysis - a preliminary report
Abstract
Background: Cystic fibrosis is the most common fatal genetic disorder in the Caucasian population. Scoring systems for assessment of Cystic fibrosis disease severity have been used for almost 50 years, without being adapted to the milder phenotype of the disease in the 21st century. The aim of this current project is to develop a new scoring system using a database and employing various statistical tools. This study protocol reports the development of the statistical tools in order to create such a scoring system.
Methods: The evaluation is based on the Cystic Fibrosis database from the cohort at the Royal Children's Hospital in Melbourne. Initially, unsupervised clustering of the all data records was performed using a range of clustering algorithms. In particular incremental clustering algorithms were used. The clusters obtained were characterised using rules from decision trees and the results examined by clinicians. In order to obtain a clearer definition of classes expert opinion of each individual's clinical severity was sought. After data preparation including expert-opinion of an individual's clinical severity on a 3 point-scale (mild, moderate and severe disease), two multivariate techniques were used throughout the analysis to establish a method that would have a better success in feature selection and model derivation: 'Canonical Analysis of Principal Coordinates' and 'Linear Discriminant Analysis'. A 3-step procedure was performed with (1) selection of features, (2) extracting 5 severity classes out of a 3 severity class as defined per expert-opinion and (3) establishment of calibration datasets.
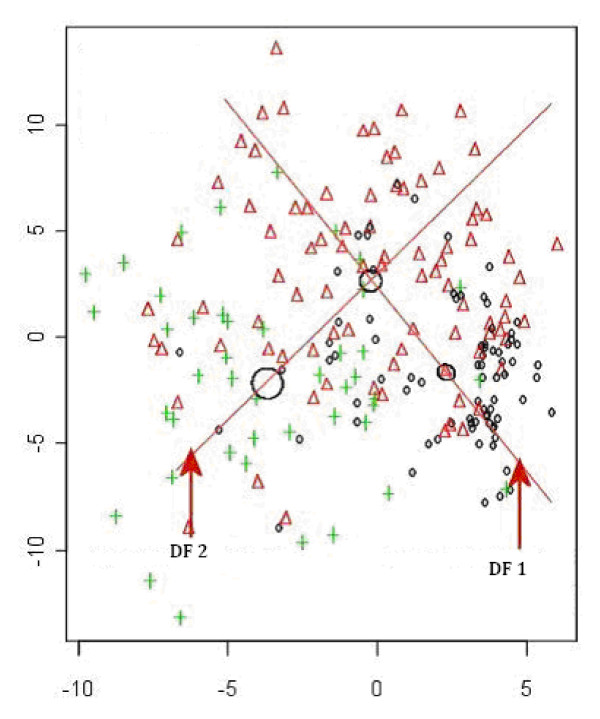
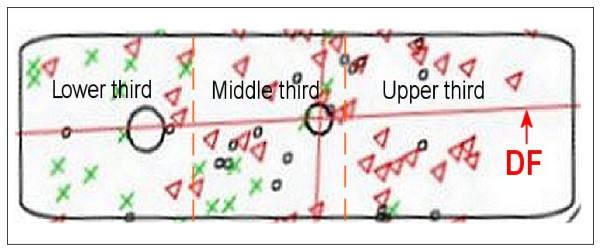
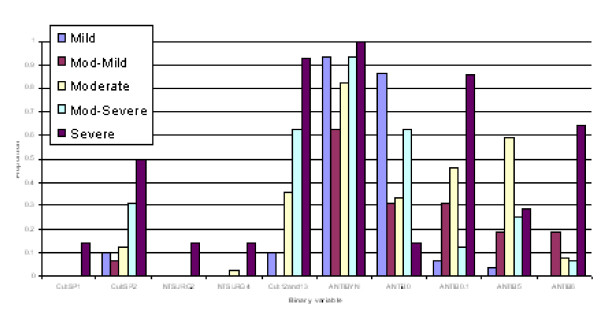
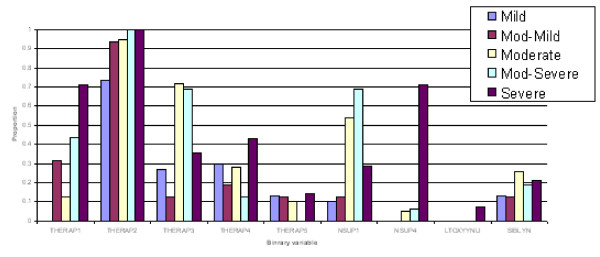
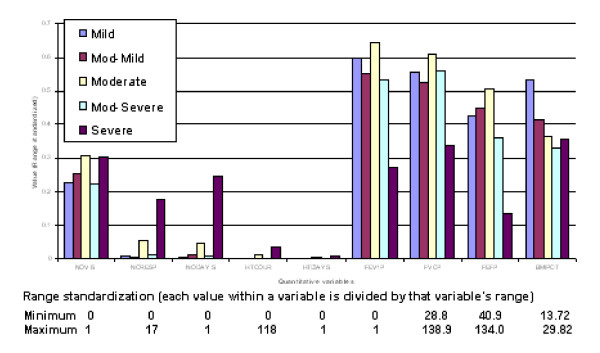
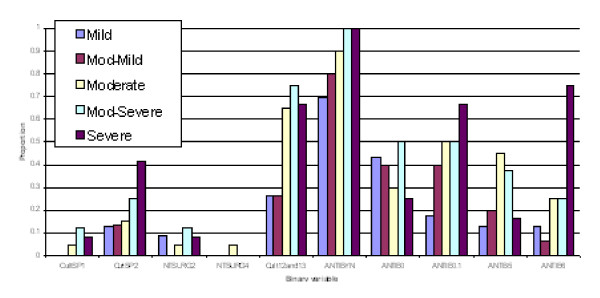
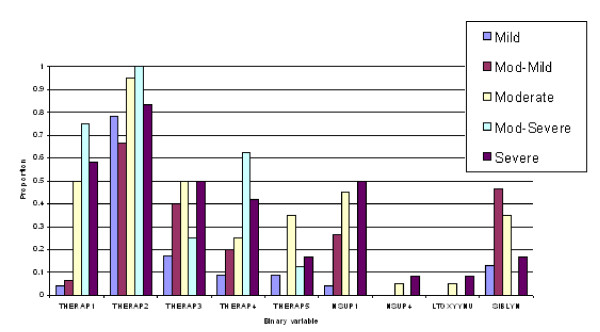
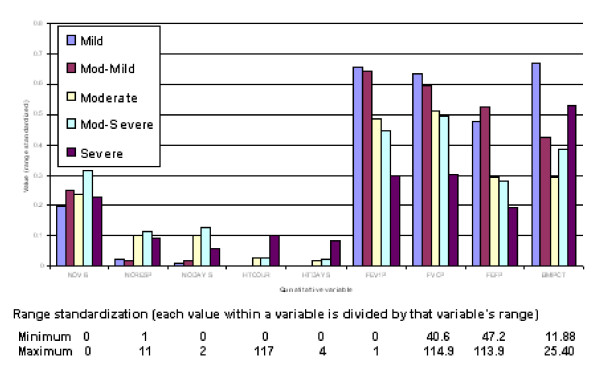
Results: (1) Feature selection: CAP has a more effective "modelling" focus than DA.(2) Extraction of 5 severity classes: after variables were identified as important in discriminating contiguous CF severity groups on the 3-point scale as mild/moderate and moderate/severe, Discriminant Function (DF) was used to determine the new groups mild, intermediate moderate, moderate, intermediate severe and severe disease. (3) Generated confusion tables showed a misclassification rate of 19.1% for males and 16.5% for females, with a majority of misallocations into adjacent severity classes particularly for males.
Conclusion: Our preliminary data show that using CAP for detection of selection features and Linear DA to derive the actual model in a CF database might be helpful in developing a scoring system. However, there are several limitations, particularly more data entry points are needed to finalize a score and the statistical tools have further to be refined and validated, with re-running the statistical methods in the larger dataset.
Figures
Similar articles
-
Clinical scoring systems in cystic fibrosis.Pediatr Pulmonol. 2006 Jul;41(7):602-17. doi: 10.1002/ppul.20376. Pediatr Pulmonol. 2006. PMID: 16703586 Review.
-
Fear of harm, a possible phenotype of pediatric bipolar disorder: a dimensional approach to diagnosis for genotyping psychiatric syndromes.J Affect Disord. 2009 Nov;118(1-3):28-38. doi: 10.1016/j.jad.2009.06.016. Epub 2009 Jul 23. J Affect Disord. 2009. PMID: 19631388
-
A simplified cystic fibrosis scoring system (a preliminary report).Can Med Assoc J. 1971 Sep 18;105(6):580-2. Can Med Assoc J. 1971. PMID: 5118677 Free PMC article.
-
Non-invasive tension time index in relation to severity of disease in children with cystic fibrosis.Pediatr Pulmonol. 2008 Oct;43(10):973-81. doi: 10.1002/ppul.20887. Pediatr Pulmonol. 2008. PMID: 18780334
-
[Introduction and critical comparison of clinical scores for characterizing the degree of morbidity of patients with cystic fibrosis].Klin Padiatr. 1993 Jan-Feb;205(1):3-8. doi: 10.1055/s-2007-1025188. Klin Padiatr. 1993. PMID: 8445850 Review. German.
Cited by
-
Inhalation treatment of cystic fibrosis with lumacaftor and ivacaftor co-delivered by nanostructured lipid carriers.J Control Release. 2019 Feb 28;296:225-231. doi: 10.1016/j.jconrel.2019.01.025. Epub 2019 Jan 21. J Control Release. 2019. PMID: 30677435 Free PMC article.
-
Multidimensional clinical phenotyping of an adult cystic fibrosis patient population.PLoS One. 2015 Mar 30;10(3):e0122705. doi: 10.1371/journal.pone.0122705. eCollection 2015. PLoS One. 2015. PMID: 25822311 Free PMC article.
-
Lung clearance index to characterize clinical phenotypes of children and adolescents with cystic fibrosis.BMC Pulm Med. 2022 Apr 1;22(1):122. doi: 10.1186/s12890-022-01903-5. BMC Pulm Med. 2022. PMID: 35365111 Free PMC article.
References
-
- Cystic Fibrosis Mutation Database http://www.genet.sickkids.on.ca/cftr
-
- Shwachman H, Kulczycki LL. Long-term study of one hundred five patients with cystic fibrosis; studies made over a five- to fourteen-year period. AMA J Dis Child. 1958;96:6–15. - PubMed
-
- Conway S, Littlewood J. Cystic Fibrosis clinical scoring systems. New York: John Wiley & Sons Ltd; 1996.
Publication types
MeSH terms
LinkOut - more resources
Full Text Sources
Medical
Miscellaneous
