. 2008 Sep 29;205(10):2397-408.
doi: 10.1084/jem.20081297. Epub 2008 Sep 22.

TSC-mTOR maintains quiescence and function of hematopoietic stem cells by repressing mitochondrial biogenesis and reactive oxygen species

Affiliations

TSC-mTOR maintains quiescence and function of hematopoietic stem cells by repressing mitochondrial biogenesis and reactive oxygen species

Chong Chen et al. J Exp Med. .

Abstract

The tuberous sclerosis complex (TSC)-mammalian target of rapamycin (mTOR) pathway is a key regulator of cellular metabolism. We used conditional deletion of Tsc1 to address how quiescence is associated with the function of hematopoietic stem cells (HSCs). We demonstrate that Tsc1 deletion in the HSCs drives them from quiescence into rapid cycling, with increased mitochondrial biogenesis and elevated levels of reactive oxygen species (ROS). Importantly, this deletion dramatically reduced both hematopoiesis and self-renewal of HSCs, as revealed by serial and competitive bone marrow transplantation. In vivo treatment with an ROS antagonist restored HSC numbers and functions. These data demonstrated that the TSC-mTOR pathway maintains the quiescence and function of HSCs by repressing ROS production. The detrimental effect of up-regulated ROS in metabolically active HSCs may explain the well-documented association between quiescence and the "stemness" of HSCs.


Figures
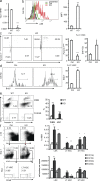
Figure 1.
Figure 1.
Loss of Tsc1 drives HSCs from quiescence to rapid proliferation and results in increased frequency and number of HSCs. (a) Tsc1 is efficiently deleted in LT-HSCs. The 6-wk-old Tsc1fl/flmx-1-cre+ mice and the Tsc1fl/flmx-1-cre littermates were treated with pIpC for 2 wk. At 10 d after completion of pIpC treatments, LT-HSCs, as defined by the FLSKCD48 phenotype, were sorted by FACS. mRNA levels were tested by real-time RT-PCR. Data shown have been normalized to HPRT. Data shown are means ± SD of results from five independent experiments. (b) The pS6 level is up-regulated in Tsc1-deficient LT-HSCs measured by flow cytometry. The x axis shows the intensity of pS6 staining, and the y axis shows the cell number. (left) Representative FACS profiles. (right) Means ± SD (n = 3) of mean fluorescence. The mean fluorescence intensity (MFI) is increased by ∼10-fold in the Tsc1-deficient HSCs. (c) RNA/DNA contents of the Ctrl and Tsc1fl/flmx-1-cre+ HSCs. Tsc1fl/flmx-1-cre+ HSCs are less quiescent than the Tsc1fl/flmx-1-cre littermates, as measured by pyronin Y (RNA contents) and HOECHST (DNA contents) staining. (left) Dot plots of gated FLSKCD48 cells are shown (numbers indicate percentages). (right) The summary data of quiescent (percentage of pyronin Ylow cells) and the percentage of S, M, and G2M cells (>2n DNA contents) are shown. Data shown are means ± SD of results from three independent experiments with a total of six mice per group. (d) Conditional deletion of the Tsc1 gene resulted in enhanced proliferation of the LT-HSCs. Mice were treated with pIpC as in panel a. BM cells were analyzed 24 h after BrdU labeling. (left) The histograms depict distributions of BrdU incorporation among the FLSKCD48 cells (numbers indicate percentages). (right) The bar graph shows the percentage of BrdU+ cells among the FLSKCD48 cells. Data shown are means ± SD of results from three independent experiments, with a total of six mice per group. (e) Tsc1-deficient WBM and HSCs have increased apoptosis, indicated as Annexin V+ 7AAD. (left) Representative profiles from one mouse per group are presented (numbers indicate percentages). (right) Means ± SD of the percentage of Annexin V+7AAD cells from four experiments with a total of eight mice per group are shown. (f) Sustained increase in the frequency and absolute number of HSCs in the pIpC-treated Tsc1fl/flmx-1-cre+ BM. At 10 and 30 d after pIpC treatments, BM from Tsc1fl/flmx-1-cre+ (KO) and Tsc1fl/flmx-1-cre (Ctrl) littermates were stained with a panel of antibodies to identify LT-HSCs and short-term HSCs (ST-HSCs). (left) Data shown are FACS profiles depicting the increase in the frequency of HSCs on day 10 after completion of the pIpC treatment (numbers indicate percentages). (right) The bar graphs summarize the sustained increase in the frequency and number of HSCs on days 10 and 30 after pIpC treatment. Data shown are means ± SD of results from three (day 30; n = 6) or five (day 10; n = 10) experiments.
Figure 2.
Figure 2.
Conditional deletion of Tsc1 results in abnormal hematopoiesis. The 6-wk-old Tsc1fl/flmx-1-cre+ mice and the Tsc1fl/flmx-1-cre littermates were treated with pIpC, as in Fig. 1. (a) Reduced number of blood cells, as determined by CBC. The number in the littermate Ctrl is defined as 100%. LY, lymphocytes; MO, monocytes; NE, neutrophils and eosinophils. (b) Progressive loss of BM cellularity in the Tsc1-deficient Tsc1fl/flmx-1-cre+ mice. (c) Reduction of multiple lineages of differentiated leukocytes in the BM at 30 d after pIpC treatments. (d) Reduction of B lymphocytes but increase of erythrocytes in the spleens of Tsc1 mutant mice at 30 d after pIpC treatments. (e) Deletion of the Tsc1 gene caused extramedullary hematopoiesis in the spleen. (left) The number of FLSK48 HSCs in the spleens of Tsc1fl/flmx-1-cre+ and Ctrl mice 10 and 30 d after pIpC treatment. Data shown in a–e are means ± SD of results from five experiments with a total of 10 mice per group. (middle) Hematoxylin and eosin staining of the spleens of Tsc1fl/flmx-1-cre+ and Ctrl littermates. The arrows indicate the high frequency of megakaryocytes. Bars, 20 μm. In five higher power fields, means of 49 and 7 megakaryocytes were found in spleen sections of Tsc1fl/flmx-1-cre+ and Ctrl littermates, respectively (n = 4). (f) Radioprotection by the Tsc1 mutant splenic HSCs. 20 × 106 spleen cells were injected into lethally irradiated recipients. The survival rates were compared by Kaplan-Meier analysis (n = 5).
Figure 3.
Figure 3.
The Tsc1 deletion causes defective hematopoiesis. (a–d) Serial BMT reveals HSC-intrinsic defects. (a) Diagram of experimental design for data in b–d. (b) Tsc1-deficient BM cells are defective in rescuing lethally irradiated recipients in the second round, which indicate a reduced function of HSCs. 106 WBM cells were used for the first round of BMT, and 3 × 10⁶ WBM cells were used for the second round of BMT. According to Fig. 1 f, 106 WBM cells from Tsc1-deficient mice contain ∼800 HSCs; those from Ctrl mice contain only ∼100 HSCs. For the WBM cells used for the second BMT, the frequency of HSCs was not analyzed. (c) Progressive loss of HSC activity as revealed by reduced replacement of recipient cells. Data shown are means ± SD of the percentage of donor cells in the blood of recipients at 6 wk after BMT (n = 15 for the first BMT, and n = 9 for the second BMT). (d) Reduced reconstitution of multiple lineages of blood cells by Tsc1fl/flmx-1-cre+ BM. Data shown are means ± SD of the relative number of cells in the blood, as measured by CBC. Data are normalized as the percentage of mean counts in mice reconstituted with WT BM. Summary data from two independent experiments involving a total of nine mice per group are presented. LY, lymphocytes; MO, monocytes; NE, neutrophils and eosinophils.
Figure 4.
Figure 4.
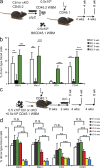
Cell-intrinsic requirement for TSC1 in the function of HSCs. (a and b) Tsc1-deficient BM cells are dramatically less competent than WT BM cells in hematopoiesis when cotransferred into newly irradiated hosts. (a) The experimental designs. (b) The percentage of donor-type cells within the indicated populations at 4 or 8 wk after transplantation. Note that although the percentage of WT BM-derived cells progressively increased, those from Tsc-deficient BM reduced to background levels within 8 wk. Data shown are means ± SD (n = 5) and have been repeated twice. (c and d) Deletion of Tsc1 after establishment of BMT reveals a cell-intrinsic and homing-independent role for Tsc1 in the function of HSCs. (c) Experimental design. The Tsc1fl/flMX-Cre+ or Tsc1fl/flMX-Cre BM were mixed at 1:1 with recipient-type BM and transferred into irradiated recipients. Tsc1 deletion is induced at 6 wk after transplantation. (d) Means ± SD (n = 5) of the percentage of donor-type cells in the blood at 4 or 8 wk after completion of pIpC treatments. The experiments have been repeated three times.
Figure 5.
Figure 5.
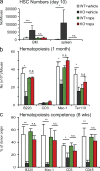
Hematopoietic functions of the Tsc1-deficient HSCs (cKO) are restored by rapamycin treatment. (a) Rapamycin inhibited expansion of HSCs in the BM and in the spleen and restored normal hematopoiesis in the Tsc1-deficient BM. 6-wk-old Tsc1fl/flMX-Cre+ (cKO) or Tsc1fl/flMX-Cre (Ctrl) mice were treated with pIpC for 2 wk. At the same time, the mice were treated with either vehicle Ctrl of 4 mg/kg rapamycin every other day throughout the entire period of the study. The HSC numbers shown were LSK cells at day 10 after completion of pIpC treatment. Similar restorations were observed on day 30. At both time points, the numbers of LT-HSCs were also reduced to normal levels (not depicted). (b) Rapamycin restores hematopoiesis in Tsc1-deficient BM. The data are the number of different lineages of cells from the BM collected at 30 d after pIpC treatments. Data shown were means ± SD (n = 4) from two independent experiments. (c) Rapamycin abrogates HSC-intrinsic functional defects caused by the deletion of Tsc1. The chimeric mice described in Fig. 4 c were treated with rapamycin, starting at the time of the pIpC treatment (4 mg/kg every other day, throughout the study). At 8 wk after completion of pIpC treatment, the mice were killed, and total and specific lineages of hematopoietic cells were analyzed by flow cytometry. Data shown are means ± SD of the percentage of cells of donor origin from two independent experiments (n = 10).
Figure 6.
Figure 6.
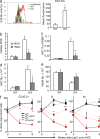
Up-regulated mitochondrial biogenesis in Tsc1-deficient, FLSKCD48 HSCs. (a) Tsc1 deletion results in increased mitochondrial biogenesis, as revealed by increased MitoTracker Green–high populations. (left) A representative FACS profile from one mouse BM LT-HSC is shown (numbers indicate percentages). (right) The summary data (means ± SD; n = 4) of the percentage of cells with high mitochondrion contents are shown. (b) Relative mitochondrion DNA contents in WT and Tsc1-deficient LT-HSCs. Mitochondrial DNA and genomic DNA were extracted from HSCs, and the copy number of mitochondrial DNA was measured by RT-PCR, normalized to genomic DNA. As a Ctrl, the mitochondrial DNA copy numbers from the tails of the Ctrl and mutant mice are measured. The mean abundance in Ctrl HSCs was defined as 1. Data shown are means ± SD (n = 3). (c) Up-regulation of the expressions of mitochondrial genes involved in oxidative phosphorylation in Tsc1-deficient HSCs. The mRNA levels of mitochondrial genes (Cyt C, Cox5a, UCP3, Hdufs8, Idh3a, and Atp5g1) are measured by real-time RT-PCR. Data shown were means ± SD of the fraction of Hprt copy numbers (n = 4). The data presented in this figure have been reproduced in at least four experiments.
Figure 7.
Figure 7.
Tsc1 maintains the function of HSCs by repressing the production of ROS. (a) The Tsc1-deficient HSCs show dramatically increased levels of ROS, as indicated by DCF-DA staining. (left) Data shown are overlays of a FACS profile. (right) Data shown are means ± SD (n = 5) of the change in mean fluorescence after subtracting autofluorescences of HSCs. (b) ROS antagonist (NAC) treatment reduces the ROS level in Tsc1 mutant HSCs. Ctrl and Tsc1-deficient mice were treated with 1 mg/ml NAC in their drinking water in conjunction with pIpC treatment and were killed 10 d after the last pIpC injection. The BM cells were stained with HSC markers (FLSK) in conjunction with the ROS sensing dye DCF-DA. Data shown are relative levels of ROS. The mean fluorescence of untreated Ctrl HSCs is artificially defined as 1. Data shown are means ± SD (n = 4). (c) The BM cellularity in Tsc1 mutant mice is significantly rescued by NAC treatment. The BM cells used were as described in b. Data shown are means ± SD (n = 4). (d and e) The HSC frequency (d) and absolute number (e) in Tsc1 mutant mice were reduced to normal levels by NAC treatment. Results are as in b and c, except that the percentages and numbers of FLSK HSCs were analyzed. (f) In stable BM chimera consisting of WT and TSCfl/fl BM cells, the reconstitution capacity of Tsc1-deficient HSCs is significantly rescued by NAC treatment. Chimera mice depicted in Fig. 4 c were treated with NAC in their drinking water, starting at the same time of pIpC treatment. Blood samples were collected at the indicated time points and were analyzed by flow cytometry for the percentage of CD45.2+ donor cell types, B220+ B cells, and CD11b+ myeloid cells of donor type. Data shown are means ± SD from two independent experiments (n = 10).

Similar articles

Cited by

References

    1. Ogawa, M. 1993. Differentiation and proliferation of hematopoietic stem cells. Blood. 81:2844–2853. - PubMed
    1. Lajtha, L.G. 1963. On the concept of the cell cycle. J. Cell. Physiol. 62(Suppl. 1):143–145. - PubMed
    1. Lajtha, L.G. 1979. Stem cell concepts. Differentiation. 14:23–34. - PubMed
    1. Zhang, J., C. Niu, L. Ye, H. Huang, X. He, W.G. Tong, J. Ross, J. Haug, T. Johnson, J.Q. Feng, et al. 2003. Identification of the haematopoietic stem cell niche and control of the niche size. Nature. 425:836–841. - PubMed
    1. Cheng, T., N. Rodrigues, H. Shen, Y. Yang, D. Dombkowski, M. Sykes, and D.T. Scadden. 2000. Hematopoietic stem cell quiescence maintained by p21cip1/waf1. Science. 287:1804–1808. - PubMed

Publication types

MeSH terms