Performance of breast ultrasound computer-aided diagnosis: dependence on image selection
- PMID: 18790394
- PMCID: PMC2567418
- DOI: 10.1016/j.acra.2008.04.016
Performance of breast ultrasound computer-aided diagnosis: dependence on image selection
Abstract
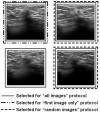
Rationale and objectives: The automated classification of sonographic breast lesions is generally accomplished by extracting and quantifying various features from the lesions. The selection of images to be analyzed, however, is usually left to the radiologist. Here we present an analysis of the effect that image selection can have on the performance of a breast ultrasound computer-aided diagnosis system.
Materials and methods: A database of 344 different sonographic lesions was analyzed for this study (219 cysts/benign processes, 125 malignant lesions). The database was collected in an institutional review board-approved, Health Insurance Portability and Accountability Act-compliant manner. Three different image selection protocols were used in the automated classification of each lesion: all images, first image only, and randomly selected images. After image selection, two different protocols were used to classify the lesions: (a) the average feature values were input to the classifier or (b) the classifier outputs were averaged together. Both protocols generated an estimated probability of malignancy. Round-robin analysis was performed using a Bayesian neural network-based classifier. Receiver-operating characteristic analysis was used to evaluate the performance of each protocol. Significance testing of the performance differences was performed via 95% confidence intervals and noninferiority tests.
Results: The differences in the area under the receiver-operating characteristic curves were never more than 0.02 for the primary protocols. Noninferiority was demonstrated between these protocols with respect to standard input techniques (all images selected and feature averaging).
Conclusion: We have proved that our automated lesion classification scheme is robust and can perform well when subjected to variations in user input.
Conflict of interest statement
Figures


Similar articles
-
Repeatability in computer-aided diagnosis: application to breast cancer diagnosis on sonography.Med Phys. 2010 Jun;37(6):2659-69. doi: 10.1118/1.3427409. Med Phys. 2010. PMID: 20632577 Free PMC article.
-
Computerized assessment of breast lesion malignancy using DCE-MRI robustness study on two independent clinical datasets from two manufacturers.Acad Radiol. 2010 Jul;17(7):822-9. doi: 10.1016/j.acra.2010.03.007. Acad Radiol. 2010. PMID: 20540907 Free PMC article.
-
Malignant and benign breast masses on 3D US volumetric images: effect of computer-aided diagnosis on radiologist accuracy.Radiology. 2007 Mar;242(3):716-24. doi: 10.1148/radiol.2423051464. Epub 2007 Jan 23. Radiology. 2007. PMID: 17244717 Free PMC article.
-
Computer-aided detection/diagnosis of breast cancer in mammography and ultrasound: a review.Clin Imaging. 2013 May-Jun;37(3):420-6. doi: 10.1016/j.clinimag.2012.09.024. Epub 2012 Nov 13. Clin Imaging. 2013. PMID: 23153689 Review.
-
Breast Lesions: Quantitative Diagnosis Using Ultrasound Shear Wave Elastography-A Systematic Review and Meta--Analysis.Ultrasound Med Biol. 2016 Apr;42(4):835-47. doi: 10.1016/j.ultrasmedbio.2015.10.024. Epub 2016 Jan 6. Ultrasound Med Biol. 2016. PMID: 26778289 Review.
Cited by
-
Deep learning in medical imaging and radiation therapy.Med Phys. 2019 Jan;46(1):e1-e36. doi: 10.1002/mp.13264. Epub 2018 Nov 20. Med Phys. 2019. PMID: 30367497 Free PMC article. Review.
-
Fuzzy c-means segmentation of major vessels in angiographic images of stroke.J Med Imaging (Bellingham). 2018 Jan;5(1):014501. doi: 10.1117/1.JMI.5.1.014501. Epub 2018 Jan 4. J Med Imaging (Bellingham). 2018. PMID: 29322070 Free PMC article.
-
Computer-aided diagnostic models in breast cancer screening.Imaging Med. 2010 Jun 1;2(3):313-323. doi: 10.2217/IIM.10.24. Imaging Med. 2010. PMID: 20835372 Free PMC article.
-
Quantitative ultrasound image analysis of axillary lymph node status in breast cancer patients.Int J Comput Assist Radiol Surg. 2013 Nov;8(6):895-903. doi: 10.1007/s11548-013-0829-3. Epub 2013 Mar 24. Int J Comput Assist Radiol Surg. 2013. PMID: 23526445
-
Computerized detection of breast cancer on automated breast ultrasound imaging of women with dense breasts.Med Phys. 2014 Jan;41(1):012901. doi: 10.1118/1.4837196. Med Phys. 2014. PMID: 24387528 Free PMC article.
References
-
- Edwards BK, Brown ML, Wingo PA, et al. Annual report to the nation on the status of cancer, 1975-2002, featuring population-based trends in cancer treatment. J Natl Cancer Inst. 2005;97:1407–1427. - PubMed
-
- Fine RE, Staren ED. Updates in breast ultrasound. Surg Clin North Am. 2004;84:1001–1034. - PubMed
-
- Kolb TM. Breast US for screening, diagnosing, and staging breast cancer: Issues and controversies; RSNA Categorical Course in Diagnostic Radiology Physics: Advances in Breast Imaging – Physics, Technology, and Clinical Applications 2004. Radiologic Society of North America; Chicago, IL: 2004. pp. 247–257.
-
- Berg WA, Gutierrez L, NessAiver MS, et al. Diagnostic accuracy of mammography, clinical examination, US, and MR imaging in preoperative assessment of breast cancer. Radiology. 2004;233:830–849. - PubMed
Publication types
MeSH terms
Grants and funding
LinkOut - more resources
Full Text Sources
Medical

