. 2008 Sep 10;28(37):9133-44.
doi: 10.1523/JNEUROSCI.1820-08.2008.

Status epilepticus induces a particular microglial activation state characterized by enhanced purinergic signaling

Affiliations

Status epilepticus induces a particular microglial activation state characterized by enhanced purinergic signaling

Elena Avignone et al. J Neurosci. .

Abstract

Microglia cells are the resident macrophages of the CNS, and their activation plays a critical role in inflammatory reactions associated with many brain disorders, including ischemia, Alzheimer's and Parkinson's diseases, and epilepsy. However, the changes of microglia functional properties in epilepsy have rarely been studied. Here, we used a model of status epilepticus (SE) induced by intraperitoneal kainate injections to characterize the properties of microglial cells in hippocampal slices from CX3CR1(eGFP/+) mice. SE induced within 3 h an increased expression of inflammatory mediators in the hippocampus, followed by a modification of microglia morphology, a microglia proliferation, and a significant neurodegeneration in CA1. Changes in electrophysiological intrinsic membrane properties of hippocampal microglia were detected at 24-48 h after SE with, in particular, the appearance of new voltage-activated potassium currents. Consistent with the observation of an upregulation of purinergic receptor mRNAs in the hippocampus, we also provide pharmacological evidence that microglia membrane currents mediated by the activation of P2 receptors, including P2X(7), P2Y(6), and P2Y(12), were increased 48 h after SE. As a functional consequence of this modification of purinergic signaling, motility of microglia processes toward a source of P2Y(12) receptor agonist was twice as fast in the epileptic hippocampus. This study is the first functional description of microglia activation in an in vivo model of inflammation and provides evidence for the existence of a particular microglial activation state after a status epilepticus.


Figures
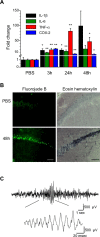
Figure 1.
Figure 1.
Status epilepticus induced by intraperitoneal kainate injection triggers inflammation, neuronal death in the hippocampus, and long-term changes in EEG activity in CXCR1eGFP/+ mice. A, Changes in expression of proinflammatory markers in the hippocampus analyzed by qPCR at different time points after induction of the status epilepticus. Tenfold to twentyfold increases in mRNA expression for IL-1β, IL-6, TNF-α, and COX-2 were observed at 3 h (n = 4 mice) compared with control (PBS; n = 4). Significant increased expression persisted at 24 h (n = 6) for all mRNA species and became more variable at 48 h (n = 6). B, Fluoro-Jade B (left) and eosin–hematoxylin (right) staining in the CA1 area of the ventral hippocampus in PBS- (top) and kainate-injected mice (bottom) 48 h after the status epilepticus. Note the strong staining of the pyramidal cell layer with both techniques in kainate-injected mice. Scale bars, 200 μm. C, Representative cortical EEG-recording from a mouse 2 months after induction of status epilepticus. The representative trace exhibits spontaneous collective activity in the form of a burst of spike discharges. The burst is shown at higher temporal resolution in the inset, where individual spike discharges can be identified. *p < 0.05; **p < 0.01.
Figure 2.
Figure 2.
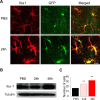
Increase in size and number of microglia in the hippocampus after status epilepticus. A, Confocal images (stack of 21 z-sections, 8.28 μm total thickness) of Iba1 immunostaining and GFP fluorescence in the CA1 stratum radium of CX3CR1eGFP/+ mice in control conditions (top) and 24 h after induction of the status epilepticus (bottom). The two markers are colocalized, confirming that GFP-expressing cells are microglia. Note the stronger Iba1 immunoreactivity, the larger somata, and the thicker proximal processes of activated microglia. Scale bar, 15 μm. B, Western blot analysis of Iba1 expression in the hippocampus of control and kainate-injected animals after 24 and 48 h. Samples were obtained from hippocampi of three animals for each condition. C, Quantification of microglial cell number in fields of view of 230 × 230 μm in the CA1 area of control (n = 4) and treated mice 24 (n = 3) and 48 h (n = 7) after the induction of the status epilepticus. The number of microglial cells was significantly larger already at 24 h and had doubled at 48 h. **p < 0.01.
Figure 3.
Figure 3.
Microglia proliferates after status epilepticus. Confocal images of GFP fluorescence and of immunostaining of the proliferation markers Ki67 (left series of panels; scale bar, 25 μm) and MAC2 (right series of panels; scale bar, 40 μm). Representative pictures (stack of 5 z-sections, 4.5 μm total thickness) of the CA1 hippocampal region obtained from PBS-injected mice and from mice killed 3, 24, and 48 h after the induction of status epilepticus are shown. Immunostaining for both markers, highly colocalized with GFP, is first observed at 24 h and increases at 48 h.
Figure 4.
Figure 4.
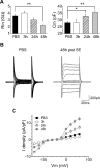
Time-dependent changes in intrinsic electrophysiological properties of microglia after status epilepticus. A, Temporal course of input resistance (left) and membrane capacitance (right) changes of CA1 hippocampal microglial cells after status epilepticus. *p < 0.05; **p < 0.01. B, Examples of current responses induced by voltage steps of 20 mV increment from −140 to +60 mV (holding potential, −60 mV) in microglia cells of control (left, black traces) and kainate-injected animals 48 h after status epilepticus (right, gray traces). C, I/V curves obtained from microglial cells recorded from control mice (black squares; n = 35) and from mice 3 (open circles; n = 7), 24 (half-filled circles; n = 15), and 48 h (filled circles; n = 39) after status epilepticus. Current densities were considered to take into account changes in membrane capacitance in activated microglia. Note the appearance of inward-rectifying currents at hyperpolarized potentials and of outward currents at depolarized potentials 24 h after the status epilepticus. Note also that the inward-rectifying currents decrease, whereas the outward currents increase, at 48 h. There was no significant difference between the I/V curves of control and 3 h conditions.
Figure 5.
Figure 5.
Status epilepticus induces an increase of purinergic receptor mRNA expression in the hippocampus. Quantitative PCR of purinergic receptors in whole hippocampi from control animals (n = 4) and from treated animals at 3 (n = 4), 24 (n = 6), and 48 h (n = 6) after the status epilepticus. Note that the expression of P2Y6 was already increased at 3 h, whereas that of other receptors was increased at 24 or 48 h. *p < 0.05; **p < 0.01.
Figure 6.
Figure 6.
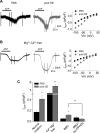
Larger P2X receptor-mediated responses in activated microglia. A, B, Examples of currents induced by bath application of ATP (black bars; 1 mm, 2 min) in microglia from control animals (left; black traces) and from mice 48 h after a status epilepticus (right; gray traces) in normal (A) and Mg2+-, Ca2+-free (B) medium. Cells were patched with a Cs-gluconate-based internal solution and held at −40 mV. The vertical fast deflections correspond to currents generated by voltage step series applied to obtain the I/V curves of the ATP responses shown on the right. Graphs on the right represent the average of ATP-induced current density/voltage relation in control (black squares; n = 12 for control medium, and n = 6 for Ca2+-, Mg2+-free medium) and 48 h after status epilepticus (gray circles; n = 13 for control medium, and n = 9 for Ca2+-, Mg2+-free medium) obtained by subtracting the I/V curve obtained before from that obtained during ATP application. C, Pharmacology of the P2X receptor-mediated responses induced by ATP (1 mm) application at −40 mV in control (black bars) and 48 h after status epilepticus induction (gray bars). Responses were enhanced in Mg2+-, Ca2+-free medium and strongly reduced by BBG (3 μm) in control as in activated microglia. However, a residual current, which was blocked by further addition of iso-PPADS (50 μm), was present in activated microglia. *p < 0.05; **p < 0.01.
Figure 7.
Figure 7.
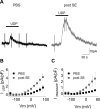
Larger P2Y6 and P2Y12 receptor-mediated responses in activated microglia. A, Examples of currents induced by bath application of the P2Y6 receptor agonist UDP (black bars; 1 mm, 1 min) in microglia from a control animal (left, black trace) and from a mouse 48 h after the status epilepticus (right, gray trace). Cells were patched with K-gluconate-based solution, and responses were tested at −20 mV. B, I/V curve of the UDP-induced responses in control (black symbols; n = 9) and epileptic (gray symbols; n = 8) mice. C, Same as in B for the P2Y12 receptor-mediated responses induced by the selective agonist 2-MeSADP application (100 μm, 1 min). Numbers of microglia are 11 in control (black bar/symbols) and 7 in treated mice (gray bar/symbols).
Figure 8.
Figure 8.
Higher motility of microglia processes after a status epilepticus. A, Examples of fluorescence images at different time points after the insertion (at t = 0; first column) in the slice of a pipette containing 2-MeSADP (100 μm) in control (top row) and 48 h after the induction of a status epilepticus (bottom). The pictures at t = 15 min (second column) show the formation of a ring of fluorescence corresponding to microglia processes elongated from cells at the periphery of the field of view toward the pipette tip in the center. At t = 25 min (right column), the processes of activated microglia have reached the pipette (bottom picture), whereas those of microglia from control mice have not yet completed their extension (top picture). Scale bar, 50 μm. B, Normalized (Norm.) ratio of the internal over the external circle fluorescence (top, left; see Materials and Methods) in experiments on control (black; n = 5 slices) and epileptic (red; n = 6 slices) mice 48 h after status epilepticus. This ratio increases when the fibers approach the pipette and reaches its maximum when all the processes are within the central circle. C, Temporal evolution of the total fluorescence measured in concentric rings (orange, second; red, third; blue, fourth; green, fifth; order starting from the external light blue ring). Left and right panels correspond to the example in control (top in A) and 48 h after status epilepticus induction (bottom in A), respectively. The distance between peaks provides a measure of the velocity of the processes. Inset, Histogram showing averages of the velocity measured in slices of control (black; n = 7) and epileptic (red; n = 4) mice. **p < 0.01.

Similar articles

Cited by

References

    1. Ben-Ari Y. Limbic seizure and brain damage produced by kainic acid: mechanisms and relevance to human temporal lobe epilepsy. Neuroscience. 1985;14:375–403. - PubMed
    1. Ben-Ari Y, Cossart R. Kainate, a double agent that generates seizures: two decades of progress. Trends Neurosci. 2000;23:580–587. - PubMed
    1. Benkovic SA, O'Callaghan JP, Miller DB. Sensitive indicators of injury reveal hippocampal damage in C57BL/6J mice treated with kainic acid in the absence of tonic-clonic seizures. Brain Res. 2004;1024:59–76. - PubMed
    1. Benkovic SA, O'Callaghan JP, Miller DB. Regional neuropathology following kainic acid intoxication in adult and aged C57BL/6J mice. Brain Res. 2006;1070:215–231. - PubMed
    1. Bianco F, Fumagalli M, Pravettoni E, D'Ambrosi N, Volonte C, Matteoli M, Abbracchio MP, Verderio C. Pathophysiological roles of extracellular nucleotides in glial cells: differential expression of purinergic receptors in resting and activated microglia. Brain Res Brain Res Rev. 2005;48:144–156. - PubMed

Publication types

MeSH terms