Effects of chronic continuous hypoxia on the expression of SLC4A8 (NDCBE) in neonatal versus adult mouse brain
- PMID: 18775686
- PMCID: PMC3222586
- DOI: 10.1016/j.brainres.2008.08.033
Effects of chronic continuous hypoxia on the expression of SLC4A8 (NDCBE) in neonatal versus adult mouse brain
Abstract
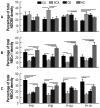
Na-coupled HCO(3) transporters (NCBTs) play important roles in brain pH regulation. One NCBT, the Na-driven Cl-HCO(3) exchanger (SLC4A8 or NDCBE), appears to be the major regulator of intracellular pH (pH(i)), at least in some hippocampal pyramidal neurons. NDCBE is widely expressed throughout the central nervous system in rodent brain. In a previous study, it has been demonstrated that CCH decreases the abundance of NBCn1 and NBCn2 proteins in four regions of the mouse brain: cerebral cortex (CX), subcortex (SCX), cerebellum (CB), and hippocampus (HC). Here we report the effect of CCH (11% O(2)) on the expression of NDCBE protein in mouse brain. Neonates (beginning at age P2) or adult mice (beginning at P90) were subjected to either normoxia or CCH for durations of 14 or 28 days. Membrane-protein levels were assessed by western blotting using our polyclonal antibody directed against NDCBE. In neonates, CCH significantly decreased NDCBE expression in HC after 14 days and SCX after 28 days, but had no significant effect for other combinations of region/duration. In adults, however, CCH significantly decreased (by 20-50%) the expression of NDCBE in all four brain regions, both with 14 and 28 day duration. Thus, the mouse brain exhibits marked developmental differences in the response of NDCBE protein expression to CCH. We hypothesize that decreases in adult NDCBE protein levels, which are probably out of proportion to the decreases in other proteins, may be part of an adaptive response that reduces energy consumption and/or stabilizes brain pH(i). The smaller or absent responses in the young animals could be related to neonatal hypoxia tolerance.
Figures


Similar articles
-
Expression and localization of Na-driven Cl-HCO(3)(-) exchanger (SLC4A8) in rodent CNS.Neuroscience. 2008 Apr 22;153(1):162-74. doi: 10.1016/j.neuroscience.2008.02.018. Epub 2008 Feb 21. Neuroscience. 2008. PMID: 18359573 Free PMC article.
-
Use of a new polyclonal antibody to study the distribution and glycosylation of the sodium-coupled bicarbonate transporter NCBE in rodent brain.Neuroscience. 2008 Jan 24;151(2):374-85. doi: 10.1016/j.neuroscience.2007.10.015. Epub 2007 Oct 25. Neuroscience. 2008. PMID: 18061361 Free PMC article.
-
Chronic continuous hypoxia decreases the expression of SLC4A7 (NBCn1) and SLC4A10 (NCBE) in mouse brain.Am J Physiol Regul Integr Comp Physiol. 2007 Dec;293(6):R2412-20. doi: 10.1152/ajpregu.00497.2007. Epub 2007 Oct 10. Am J Physiol Regul Integr Comp Physiol. 2007. PMID: 17928512
-
Modular structure of sodium-coupled bicarbonate transporters.J Exp Biol. 2009 Jun;212(Pt 11):1697-706. doi: 10.1242/jeb.028563. J Exp Biol. 2009. PMID: 19448079 Free PMC article. Review.
-
Cation-coupled bicarbonate transporters.Compr Physiol. 2014 Oct;4(4):1605-37. doi: 10.1002/cphy.c130005. Compr Physiol. 2014. PMID: 25428855 Free PMC article. Review.
Cited by
-
The divergence, actions, roles, and relatives of sodium-coupled bicarbonate transporters.Physiol Rev. 2013 Apr;93(2):803-959. doi: 10.1152/physrev.00023.2012. Physiol Rev. 2013. PMID: 23589833 Free PMC article. Review.
-
Anion transport and GABA signaling.Front Cell Neurosci. 2013 Oct 24;7:177. doi: 10.3389/fncel.2013.00177. Front Cell Neurosci. 2013. PMID: 24187533 Free PMC article. Review.
-
Engaging neuroscience to advance translational research in brain barrier biology.Nat Rev Neurosci. 2011 Mar;12(3):169-82. doi: 10.1038/nrn2995. Nat Rev Neurosci. 2011. PMID: 21331083 Free PMC article. Review.
-
The role of Na+-coupled bicarbonate transporters (NCBT) in health and disease.Pflugers Arch. 2024 Apr;476(4):479-503. doi: 10.1007/s00424-024-02937-w. Epub 2024 Mar 27. Pflugers Arch. 2024. PMID: 38536494 Free PMC article. Review.
-
Reality of Inhibitory GABA in Neonatal Brain: Time to Rewrite the Textbooks?J Neurosci. 2016 Oct 5;36(40):10242-10244. doi: 10.1523/JNEUROSCI.2270-16.2016. J Neurosci. 2016. PMID: 27707962 Free PMC article. No abstract available.
References
-
- Adolph EF. Regulations during survival without oxygen in infant mammals. Respir Physiol. 1969;7 (3):356–368. - PubMed
-
- Boedtkjer E, Praetorius J, Fuchtbauer EM, Aalkjaer C. Antibody-independent localization of the electroneutral Na+, HCO3− cotransporter NBCn1 (slc4a7) in mice. Am J Physiol Cell Physiol. 2008;294 (2):C591–603. - PubMed
-
- Boron WF. Regulation of intracellular pH. Adv Physiol Educ. 2004;28(4):160–179. - PubMed
-
- Boron WF, De Weer P. Active proton transport stimulated by CO2/HCO3− blocked by cyanide. Nature. 1976a;259:240–241. - PubMed
Publication types
MeSH terms
Substances
Grants and funding
LinkOut - more resources
Full Text Sources
Molecular Biology Databases

