. 2008 Oct;14(10):1112-7.
doi: 10.1038/nm.1866. Epub 2008 Aug 31.

The Creb1 coactivator Crtc1 is required for energy balance and fertility

Affiliations

The Creb1 coactivator Crtc1 is required for energy balance and fertility

Judith Y Altarejos et al. Nat Med. 2008 Oct.

Abstract

The adipocyte-derived hormone leptin maintains energy balance by acting on hypothalamic leptin receptors (Leprs) that act on the signal transducer and activator of transcription 3 (Stat3). Although disruption of Lepr-Stat3 signaling promotes obesity in mice, other features of Lepr function, such as fertility, seem normal, pointing to the involvement of additional regulators. Here we show that the cyclic AMP responsive element-binding protein-1 (Creb1)-regulated transcription coactivator-1 (Crtc1) is required for energy balance and reproduction-Crtc1(-/-) mice are hyperphagic, obese and infertile. Hypothalamic Crtc1 was phosphorylated and inactive in leptin-deficient ob/ob mice, while leptin administration increased amounts of dephosphorylated nuclear Crtc1. Dephosphorylated Crtc1 stimulated expression of the Cartpt and Kiss1 genes, which encode hypothalamic neuropeptides that mediate leptin's effects on satiety and fertility. Crtc1 overexpression in hypothalamic cells increased Cartpt and Kiss1 gene expression, whereas Crtc1 depletion decreased it. Indeed, leptin enhanced Crtc1 activity over the Cartpt and Kiss1 promoters in cells overexpressing Lepr, and these effects were disrupted by expression of a dominant-negative Creb1 polypeptide. As leptin administration increased recruitment of hypothalamic Crtc1 to Cartpt and Kiss1 promoters, our results indicate that the Creb1-Crtc1 pathway mediates the central effects of hormones and nutrients on energy balance and fertility.


Figures
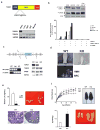
Figure 1
Figure 1
Mice with a knockout of TORC1 are obese and infertile. A. Top, schematic of TORC1 showing conserved CREB binding domain (CBD) as well as regulatory (REG) and transcriptional activation (TAD) domains; inset shows sequence of regulatory Ser151 site (bolded), which sequesters TORC1 in the cytoplasm following its phosphorylation by members of the AMPK family of Ser/Thr kinases. Bottom, immunoblot of TORC1 protein amounts in various tissues. B. Top, immunoblot showing effect of calcium ionophore (A23187; 1μM) and FSK (1μM) on amounts of slower-migrating phospho-TORC1 and faster-migrating unphosphorylated TORC1 (P-TORC1 and TORC1, respectively) in hypothalamic GT1-7 cells. Amounts of Ser133-phosphorylated CREB (P-CREB) indicated. Bottom, transient assay showing effect of wild-type TORC1 or S151A mutant TORC1 on CRE-luc reporter activity in cells exposed to FSK (1μM) and A23187 (1μM); cells expressing dominant negative CREB polypeptide A-CREB indicated. Data are representative of at least three independent experiments. P<0.05 for multiple comparisons between the groups is considered statistically significant. Pertinent comparisons are discussed in the text. C. Top, schematic showing disruption of the TORC1 gene through insertion of the gene trap vector pGT0lxf containing Engrailed 2 (EN2) sequences, splice acceptor (SA), β-galactosidase-neomycin resistance (β-Geo) gene cassette, and polyadenylation sequence (pA) between exons 4 and 5, within the coding region (between aa. 148–149) of the TORC1 gene. Primers used to verify insertion of the gene trap (A and B) and for genotyping animals (A, C and D) indicated. Bottom left, PCR analysis of genomic DNA from wild-type, TORC1 +/− (het), and TORC1 −/− (ko) mice showing presence of wild-type (detected with primers A and C) and mutant (detected with primers A and D) TORC1 alleles. Bottom right, immunoblot showing relative TORC1 protein amounts in whole brain extracts from wild-type, TORC1 +/−, and TORC1 −/− mice. Amounts of CREB and TORC2 protein also indicated. D. Immunohistochemical analysis of TORC1 expression in the hypothalamus. Top, TORC1 protein staining in arcuate and ventromedial nuclei in wild-type (left) or TORC1 −/− mice (right). Bottom, TORC1 promoter activity in hypothalamic sections from TORC1 −/− mice, evaluated by in situ hybridization analysis using inserted β-galactosidase (β-Geo) probe. E. Top left, plasma levels of luteinizing hormone in TORC1 −/− and wild-type female littermates (*; P<0.05, n=3). Top right, relative uterine morphology in control and TORC1 knockout mice. Bottom, Hematoxylin-Eosin staining of ovarian sections from wild-type and TORC1 −/− mice. Arrow points to corpus luteum in wild-type but not KO mice. F. Top left, relative weights of wild-type, TORC1 +/−, and TORC1 −/− mice from 4 to 36 weeks of age (*; P<0.05 compared to wild-type mice; #, P<0.05 compared to TORC +/− mice, n=6–37; data are means±s.e.m.). Right, appearance of wild-type and TORC1 −/− littermates at 36 weeks. Bottom, epididymal fat pad mass in 36 week old control and TORC1 −/− mice. (*; P<0.05, n=6–10 per group)
Figure 2
Figure 2
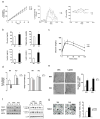
TORC1 −/− mice are hyperphagic and have reduced energy expenditure. A. Left, cumulative food intake over a 45 day interval, beginning at 12 weeks of age, in TORC1 −/−, TORC1 +/−, and wild-type littermates maintained on a normal chow diet (*; P<0.05, n=7–8; data are means±s.e.m.). Physical activity (center) and oxygen consumption (right) in 14 week old TORC1 −/− and control littermates (n=4 mice per group). B. Circulating glucose (top left), and triglyceride (top right) concentrations in 36 week old wild-type, TORC1 +/−, and TORC1 −/− mice (*; P<0.05, n=5–8 per group). Bottom, circulating plasma insulin (left) and leptin (right) concentrations (*;P<0.05, n=5–12 per group). C. Glucose tolerance testing (*; P<0.05, n=4–5) of wild-type and TORC1 −/− animals. D. Effect of subcutaneous infusion of vehicle or leptin (10 days; 300ng/h) on body weight (left) and average daily food intake (right) in wild-type and TORC1 −/− mice (*; P<0.05 compared to vehicle-infused wild-type mice; #, P<0.05 compared to leptin-infused wild-type mice, n=5–7; data are means±s.e.m.). E. Left, effect of leptin or vehicle infusion (see panel D) on P-STAT3 staining in arcuate cells of wild-type and TORC −/− mice. Right, cell counts for P-STAT3-positive cells in vehicle or leptin-infused wild-type and TORC −/− mice (*; P<0.05 compared to vehicle-infused wild-type mice; $, P<0.05 compared to vehicle-infused TORC −/−mice, n=3; data are means±s.e.m.). F. Left, immunoblot showing amounts of total and phospho (Ser151)TORC1 in cortex (Cx), hypothalamus (Hypo), and amygdala (Amy) from lean or leptin deficient ob/ob mice. Right, immunoblot showing effect of leptin or saline (PBS) injection IP on amounts of total and phospho (Ser151)TORC1 in hypothalamic extracts from lean and ob/ob mice under fasted or refeeding conditions. G. Left, immunohistochemical analysis of TORC1 staining in representative arcuate sections from ob/ob mice injected (IP) with leptin (3μg/g) or saline control. Arrows point to predominant cytoplasmic TORC1 staining in control sections and nuclear TORC1 staining in leptin-treated sections. Right, graph showing % TORC1-positive nuclei identified in hypothalamic sections from saline or leptin treated ob/ob mice.
Figure 3
Figure 3
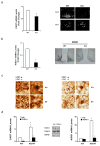
Reduced hypothalamic expression of anorexigenic and reproductive neuropeptide genes in TORC1 −/− mice. A. Q-PCR (left) (*; P<0.05, n=3) and in situ hybridization (right) analysis of CART mRNA amounts in wild-type and TORC1 −/− mice. In situ hybridization analysis of melanin concentrating hormone (MCH) mRNA in wild-type and TORC1 −/− mice shown for comparison. B. Q-PCR (left) (*; P<0.05, n=5–6) and immunohistochemical analysis (right) of KISS1 expression in hypothalami of TORC1 −/− and control littermates. Right, relative kisspeptin staining in arcuate sections from wild-type and TORC1−/− mice using anti-kisspeptin-10 antiserum. C. Left, dual immunohistochemistry and in situ hybridization for CART and TORC1 promoter-driven β-Gal, respectively, in colchicine-treated TORC1 −/− mice and control littermates. Right, dual immunohistochemistry and in situ hybridization for KISS1 and β-Gal, respectively, in colchicine-treated TORC1 −/− mice and control littermates. Black arrows indicate cells with positive immunostaining. Blue arrows indicate cells positive for β-Gal mRNA. White boxes outline the magnified inset shown to the right of the corresponding panel. D. Effect of A23187 exposure (1μM; 2 hours) on mRNA amounts for CART (left) and KISS1 (right) in control and TORC1-depleted GT1-7 cells (*; P<0.05 compared to vehicle-treated cells expressing unspecific RNAi; #, P<0.05 compared to A23187-treated cells expressing unspecific RNAi, data are means±s.e.m.). Middle, immunoblot showing effect of RNAi-mediated TORC1 knockdown on TORC1 protein amounts relative to control cells expressing unspecific (USi) RNAi.
Figure 4
Figure 4
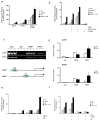
CART and KISS1 genes are direct targets of TORC1 and CREB in the hypothalamus. A. and B. Transient transfection assay of HEK293T cells using CART-luciferase (A) and KISS1-luciferase (B) reporters. Exposure to FSK (1μM) and A23187 (1μM), alone or in combination, indicated. Relative effect of wild-type TORC1 and phosphorylation-defective S151A TORC1 expression on reporter activity shown. Co-transfection of dominant negative A-CREB expression plasmid indicated. Data are representative of at least three independent experiments. P<0.05 for multiple comparisons between the groups is considered statistically significant. Pertinent comparisons are discussed in the text. C. Top, chromatin immunoprecipitation (ChIP) assay of GT1-7 cells exposed to FSK (F; 1μM), A23187 (A; 1μM), or vehicle (V) for 1 hour. Recovery of CART and KISS1 promoter fragments from immunoprecipitates of CREB and TORC1 relative to control IgG shown. Input amounts of CART and KISS1 promoter DNA indicated. Bottom, schematic of CART and KISS1 promoters showing location of conserved CREB binding sites (CRE) relative to the transcription start site. D. ChIP assay of hypothalamic tissue from ob/ob mice injected IP with saline (Veh) or leptin (3μg/g) for 1 hour. Relative occupancy of hypothalamic CREB and TORC1 over CART and KISS1 promoters in control and leptin-injected mice indicated. CREB and TORC1 occupancy is statistically significant compared (P<0.05) to the relevant IgG controls. * indicates P<0.05 compared to hypothalami from vehicle-treated ob/ob mice. E. and F. Transient transfection assay of HEK293T cells using CART (E) or KISS1 (F) luciferase reporters. Effect of leptin treatment (100nM) on reporter activity in control and leptin receptor (LRb) expressing cells shown; co-treatment with FSK (1μM) indicated. Expression of wild-type TORC1 or phosphorylation-defective S151A TORC1 indicated. Effect of dominant negative A-CREB on reporter activity shown. P<0.05 for multiple comparisons between the groups is considered statistically significant. Pertinent comparisons are discussed in the text.

Comment in

Similar articles

Cited by

References

    1. Friedman JM. The function of leptin in nutrition, weight, and physiology. Nutr Rev. 2002;60:S1–14. discussion S68–84, 85–7. - PubMed
    1. Bjorbaek C, Kahn BB. Leptin signaling in the central nervous system and the periphery. Recent Prog Horm Res. 2004;59:305–31. - PubMed
    1. Badman MK, Flier JS. The adipocyte as an active participant in energy balance and metabolism. Gastroenterology. 2007;132:2103–15. - PubMed
    1. Myers MG, Cowley MA, Munzberg H. Mechanisms of Leptin Action and Leptin Resistance. Annu Rev Physiol. 2008;70:537–556. - PubMed
    1. Lambert PD, et al. CART peptides in the central control of feeding and interactions with neuropeptide Y. Synapse. 1998;29:293–8. - PubMed

Publication types

MeSH terms

Associated data