

Phase I study of noninvasive imaging of adenovirus-mediated gene expression in the human prostate
- PMID: 18714306
- PMCID: PMC3127288
- DOI: 10.1038/mt.2008.172
Phase I study of noninvasive imaging of adenovirus-mediated gene expression in the human prostate
Abstract
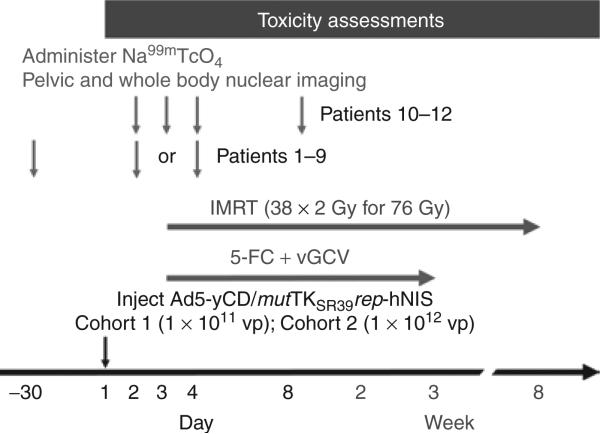
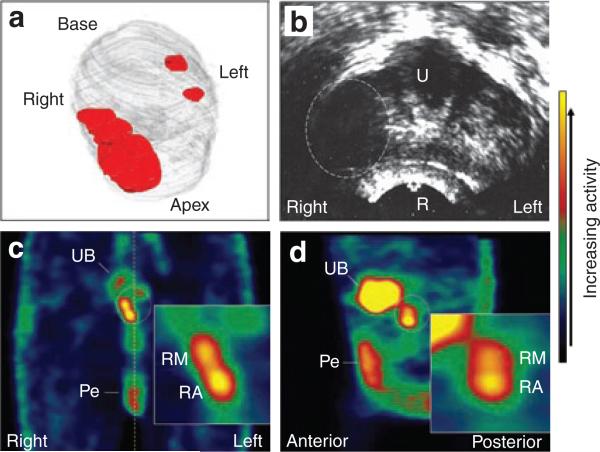
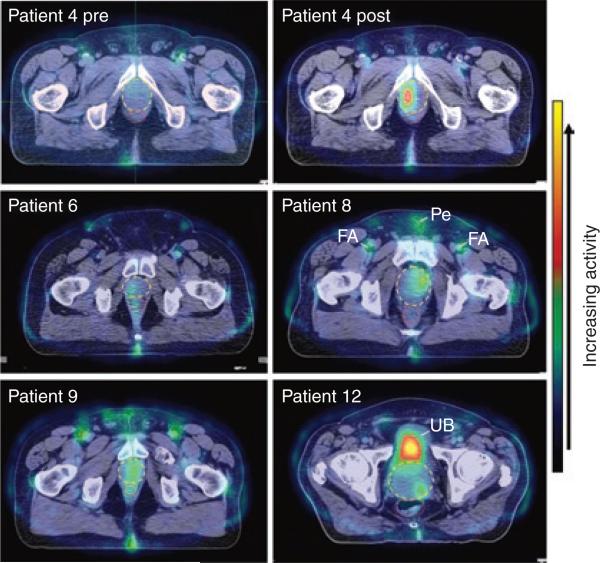
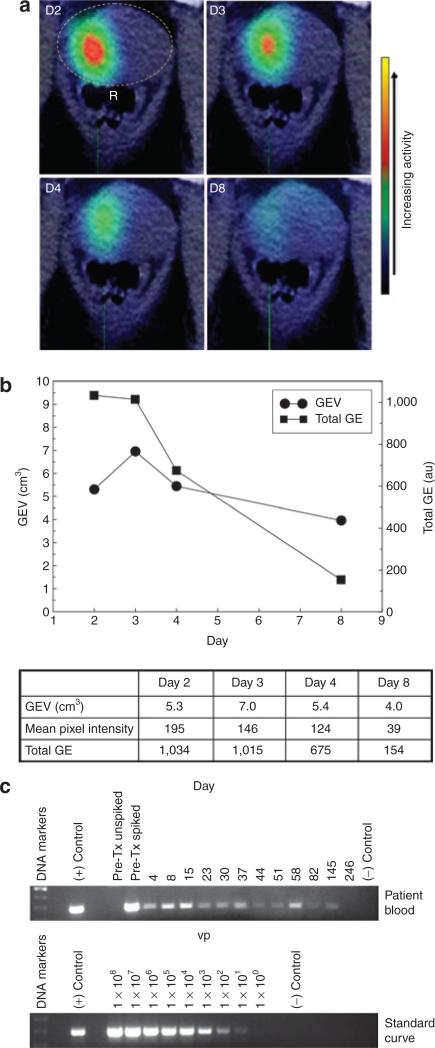
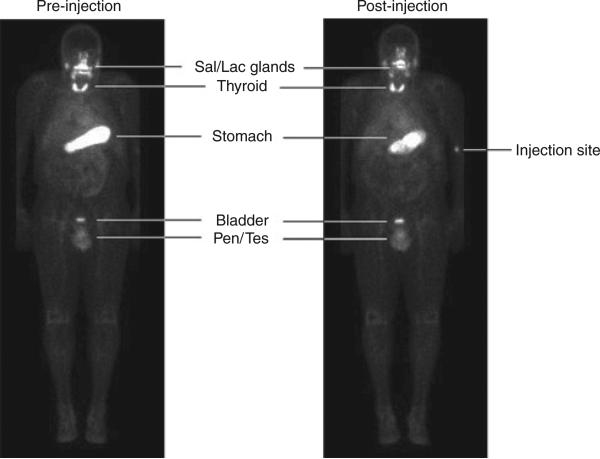
To monitor noninvasively potentially therapeutic adenoviruses for cancer, we have developed a methodology based on the sodium iodide symporter (NIS). Men with clinically localized prostate cancer were administered an intraprostatic injection of a replication-competent adenovirus, Ad5-yCD/utTK(SR39)rep-hNIS, armed with two suicide genes and the NIS gene. NIS gene expression (GE) was imaged noninvasively by uptake of Na(99 m)TcO(4) in infected cells using single photon emission-computed tomography (SPECT). The investigational therapy was safe with 98% of the adverse events being grade 1 or 2. GE was detected in the prostate in seven of nine (78%) patients at 1 x 10(12) virus particles (vp) but not at 1 x 10(11) vp. Volume and total amount of GE was quantified by SPECT. Following injection of 1 x 10(12) vp in 1 cm(3), GE volume (GEV) increased to a mean of 6.6 cm(3), representing, on average, 18% of the total prostate volume. GEV and intensity peaked 1-2 days after the adenovirus injection and was detectable in the prostate up to 7 days. Whole-body imaging demonstrated intraprostatic gene expression, and there was no evidence of extraprostatic dissemination of the adenovirus by SPECT imaging. The results demonstrate that noninvasive imaging of adenovirus-mediated gene therapy in humans is feasible and safe.
Figures
Comment in
-
Sodium iodide symporter SPECT imaging of a patient treated with oncolytic adenovirus Ad5/3-Δ24-hNIS.Mol Ther. 2011 Apr;19(4):629-31. doi: 10.1038/mt.2011.31. Mol Ther. 2011. PMID: 21455206 Free PMC article. No abstract available.
Similar articles
-
Feasibility of adenovirus-mediated hNIS gene transfer and 131I radioiodine therapy as a definitive treatment for localized prostate cancer.Mol Ther. 2011 Jul;19(7):1353-9. doi: 10.1038/mt.2011.89. Epub 2011 May 17. Mol Ther. 2011. PMID: 21587209 Free PMC article. Clinical Trial.
-
GENIS: gene expression of sodium iodide symporter for noninvasive imaging of gene therapy vectors and quantification of gene expression in vivo.Mol Ther. 2003 Sep;8(3):508-18. doi: 10.1016/s1525-0016(03)00153-9. Mol Ther. 2003. PMID: 12946325
-
Design considerations for incorporating sodium iodide symporter reporter gene imaging into prostate cancer gene therapy trials.Hum Gene Ther. 2007 Apr;18(4):312-22. doi: 10.1089/hum.2006.131. Hum Gene Ther. 2007. PMID: 17408358
-
Replication-competent adenovirus-mediated suicide gene therapy with radiation in a preclinical model of pancreatic cancer.Mol Ther. 2007 Sep;15(9):1600-6. doi: 10.1038/sj.mt.6300212. Epub 2007 Jun 12. Mol Ther. 2007. PMID: 17551507
-
Second-generation replication-competent oncolytic adenovirus armed with improved suicide genes and ADP gene demonstrates greater efficacy without increased toxicity.Mol Ther. 2006 Feb;13(2):347-56. doi: 10.1016/j.ymthe.2005.10.005. Epub 2005 Nov 14. Mol Ther. 2006. PMID: 16290236
Cited by
-
Normalisation to blood activity is required for the accurate quantification of Na/I symporter ectopic expression by SPECT/CT in individual subjects.PLoS One. 2012;7(3):e34086. doi: 10.1371/journal.pone.0034086. Epub 2012 Mar 21. PLoS One. 2012. PMID: 22470517 Free PMC article.
-
Assessment of the Na/I symporter as a reporter gene to visualize oncolytic adenovirus propagation in peritoneal tumours.Eur J Nucl Med Mol Imaging. 2010 Jul;37(7):1377-85. doi: 10.1007/s00259-009-1379-3. Epub 2010 Feb 6. Eur J Nucl Med Mol Imaging. 2010. PMID: 20140612
-
Oncolytic adenoviruses armed with thymidine kinase can be traced by PET imaging and show potent antitumoural effects by ganciclovir dosing.PLoS One. 2011;6(10):e26142. doi: 10.1371/journal.pone.0026142. Epub 2011 Oct 18. PLoS One. 2011. PMID: 22028820 Free PMC article.
-
Theranostic potential of oncolytic vaccinia virus.Theranostics. 2012;2(4):363-73. doi: 10.7150/thno.3724. Epub 2012 Apr 5. Theranostics. 2012. PMID: 22509200 Free PMC article.
-
Sodium iodide symporter for nuclear molecular imaging and gene therapy: from bedside to bench and back.Theranostics. 2012;2(4):392-402. doi: 10.7150/thno.3722. Epub 2012 Apr 11. Theranostics. 2012. PMID: 22539935 Free PMC article.
References
-
- Tjuvajev JG, Finn R, Watanabe K, Joshi R, Oku T, Kennedy J, et al. Noninvasive imaging of herpes virus thymidine kinase gene transfer and expression: a potential method for monitoring clinical gene therapy. Cancer Res. 1996;56:4087–4095. - PubMed
-
- Shimura H, Haraguchi K, Miyazaki A, Endo T, Onaya T. Iodide uptake and experimental 131I therapy in transplanted undifferentiated thyroid cancer cells expressing the Na/I symporter gene. Endocrinology. 1997;138:4493–4496. - PubMed
-
- Tjuvajev JG, Chen SH, Joshi A, Joshi R, Guo ZS, Balatoni J, et al. Imaging adenoviral-mediated herpes virus thymidine kinase gene transfer and expression in vivo. Cancer Res. 1999;59:5186–5193. - PubMed
-
- MacLaren DC, Gambhir SS, Satyamurthy N, Barrio JR, Sharfstein S, Toyokuni T, et al. Repetitive, non-invasive imaging of the dopamine D2 receptor as a reporter gene in living animals. Gene Ther. 1999;6:785–791. - PubMed
Publication types
MeSH terms
Substances
Grants and funding
LinkOut - more resources
Full Text Sources
Other Literature Sources
