

Sharing the burden: antigen transport and firebreaks in immune responses
- PMID: 18708323
- PMCID: PMC2659692
- DOI: 10.1098/rsif.2008.0258
Sharing the burden: antigen transport and firebreaks in immune responses
Abstract
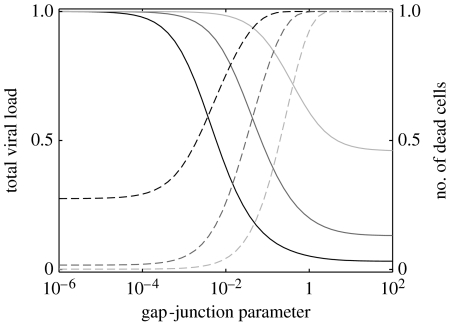
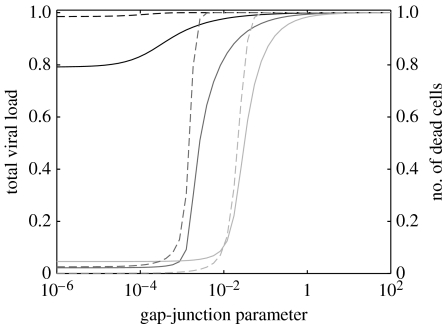
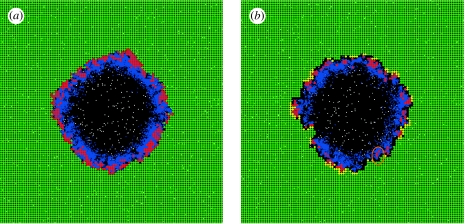
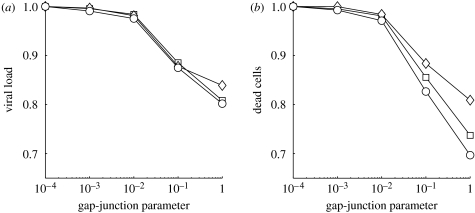
Communication between cells is crucial for immune responses. An important means of communication during viral infections is the presentation of viral antigen on the surface of an infected cell. Recently, it has been shown that antigen can be shared between infected and uninfected cells through gap junctions, connexin-based channels, that allow the transport of small molecules. The uninfected cell receiving antigen can present it on its surface. Cells presenting viral antigen are detected and killed by cytotoxic T lymphocytes. The killing of uninfected cells can lead to increased immunopathology. However, the immune response might also profit from killing those uninfected bystander cells. One benefit might be the removal of future 'virus factories'. Another benefit might be through the creation of 'firebreaks', areas void of target cells, which increase the diffusion time of free virions, making their clearance more likely. Here, we use theoretical models and simulations to explore how the mechanism of gap junction-mediated antigen transport (GMAT) affects the dynamics of the virus and immune response. We show that under the assumption of a well-mixed system, GMAT leads to increased immunopathology, which always outweighs the benefit of reduced virus production due to the removal of future virus factories. By contrast, a spatially explicit model leads to quite different results. Here we find that the firebreak mechanism reduces both viral load and immunopathology. Our study thus shows the potential benefits of GMAT and illustrates how spatial effects may be crucial for the quantitative understanding of infection dynamics and immune responses.
Figures


Similar articles
-
Gap junction-mediated antigen transport in immune responses.Trends Immunol. 2007 Nov;28(11):463-6. doi: 10.1016/j.it.2007.08.006. Epub 2007 Oct 24. Trends Immunol. 2007. PMID: 17951108
-
Cross-presentation by intercellular peptide transfer through gap junctions.Nature. 2005 Mar 3;434(7029):83-8. doi: 10.1038/nature03290. Nature. 2005. PMID: 15744304
-
Gap junction-mediated intercellular communication in the immune system.Prog Biophys Mol Biol. 2007 May-Jun;94(1-2):207-18. doi: 10.1016/j.pbiomolbio.2007.03.008. Epub 2007 Mar 15. Prog Biophys Mol Biol. 2007. PMID: 17467043 Review.
-
Coupling and cross-presentation.Nature. 2005 Mar 3;434(7029):27-8. doi: 10.1038/434027a. Nature. 2005. PMID: 15744280 No abstract available.
-
Information sharing and collateral damage.Trends Mol Med. 2005 Aug;11(8):350-2. doi: 10.1016/j.molmed.2005.06.009. Trends Mol Med. 2005. PMID: 16002338 Review.
Cited by
-
How sticky should a virus be? The impact of virus binding and release on transmission fitness using influenza as an example.J R Soc Interface. 2014 Jan 15;11(92):20131083. doi: 10.1098/rsif.2013.1083. Print 2014 Mar 6. J R Soc Interface. 2014. PMID: 24430126 Free PMC article.
-
Plasticity in transmission strategies of the malaria parasite, Plasmodium chabaudi: environmental and genetic effects.Evol Appl. 2013 Feb;6(2):365-76. doi: 10.1111/eva.12005. Epub 2012 Oct 10. Evol Appl. 2013. PMID: 23467678 Free PMC article.
-
Virus replication strategies and the critical CTL numbers required for the control of infection.PLoS Comput Biol. 2011 Nov;7(11):e1002274. doi: 10.1371/journal.pcbi.1002274. Epub 2011 Nov 17. PLoS Comput Biol. 2011. PMID: 22125483 Free PMC article.
-
Quantifying the early immune response and adaptive immune response kinetics in mice infected with influenza A virus.J Virol. 2010 Jul;84(13):6687-98. doi: 10.1128/JVI.00266-10. Epub 2010 Apr 21. J Virol. 2010. PMID: 20410284 Free PMC article.
-
Agent-based modeling of the immune system: NetLogo, a promising framework.Biomed Res Int. 2014;2014:907171. doi: 10.1155/2014/907171. Epub 2014 Apr 22. Biomed Res Int. 2014. PMID: 24864263 Free PMC article.
References
-
- Belz G.T., Xie W., Doherty P.C. Diversity of epitope and cytokine profiles for primary and secondary influenza a virus-specific CD8+T cell responses. J. Immunol. 2001;166:4627–4633. - PubMed
Publication types
MeSH terms
Substances
Grants and funding
LinkOut - more resources
Full Text Sources
Miscellaneous
