. 2008 Nov 7;283(45):30461-70.
doi: 10.1074/jbc.M805400200. Epub 2008 Aug 7.

UCP2 modulates cell proliferation through the MAPK/ERK pathway during erythropoiesis and has no effect on heme biosynthesis

Affiliations

UCP2 modulates cell proliferation through the MAPK/ERK pathway during erythropoiesis and has no effect on heme biosynthesis

Alvaro Elorza et al. J Biol Chem. .

Abstract

UCP2, an inner membrane mitochondrial protein, has been implicated in bioenergetics and reactive oxygen species (ROS) modulation. High levels of UCP2 mRNA were recently found in erythroid cells where UCP2 is hypothesized to function as a facilitator of heme synthesis and iron metabolism by reducing ROS production. We examined UCP2 protein expression and role in mice erythropoiesis in vivo. UCP2 was mainly expressed at early stages of erythroid maturation when cells are not fully committed in heme synthesis. Iron incorporation into heme was unaltered in reticulocytes from UCP2-deficient mice. Although heme synthesis was not influenced by UCP2 deficiency, mice lacking UCP2 had a delayed recovery from chemically induced hemolytic anemia. Analysis of progenitor cells from bone marrow and fetal liver both in vitro and in vivo revealed that UCP2 deficiency results in a significant decrease in cell proliferation at the erythropoietin-dependent phase of erythropoiesis. This was accompanied by reduction in the phosphorylated form of ERK, a ROS-dependent cytosolic regulator of cell proliferation. Analysis of ROS in UCP2 null erythroid cells revealed altered distribution of ROS, resulting in decreased cytosolic and increased mitochondrial ROS. Restoration of the cytosol oxidative state of erythroid progenitor cells by the pro-oxidant Paraquat reversed the effect of UCP2 deficiency on cell proliferation in in vitro differentiation assays. Together, these results indicate that UCP2 is a regulator of erythropoiesis and suggests that inhibition of UCP2 function may contribute to the development of anemia.


Figures
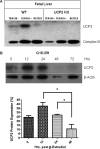
FIGURE 1.
FIGURE 1.
Expression of UCP2 in erythropoietic cells. A, E13.5 Fetal livers from WT and KO mice were treated with ACK lysis buffer to eliminate hemoglobin containing cells (mainly chromatophilic erythroblasts and reticulocytes). Ter119 (BFU-E, CFU-E and proerythroblasts) and Ter119+ (early and late basophilic erythroblast) cells were then isolated using anti-Ter119 antibody. Reticulocytes were obtained from peripheral blood at day 6 post-induction of hemolytic anemia with phenylhydrazine. Reticulocyte content was 50–70%. Samples were analyzed by Western blot. Maximal expression of UCP2 was seen in the Ter119+ samples and was minimal in reticulocytes (RETICS). Complex III of the mitochondrial respiratory chain was used as loading control. B, kinetic study of UCP2 expression during differentiation of the inducible proerythroblast cell line, G1E-ER. After induction of differentiation with 1 × 10⁻⁶ m β-estradiol, samples were collected at 0, 12, 24, 48, and 72 h and analyzed by Western blot (upper panel). UCP2 is induced during the first 12 h of differentiation and decreases thereafter. This expression pattern correlates with the proliferation phase (0–24 h) and the onset of hemoglobin synthesis, respectively. β-Actin was used as loading control. Lower panel, densitometry analysis of UCP2 expression during G1E-ER differentiation. (p = 0.0084, one way analysis of variance).
FIGURE 2.
FIGURE 2.
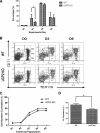
Erythropoietic response of UCP2 KO and WT mice to PH-induced hemolytic anemia. Mice were injected with 50 mg/K PH at D0, D1, and D3 and samples collected at D0, D3, D6, and D9. A, peripheral blood analysis of reticulocyte percentage. Both genotypes increased reticulocyte percentage throughout the course of the experiment. However, UCP2 KO mouse exhibited a reduced level during the acute marrow response phase (D3) (p = 0.0271, one-tailed Mann Whitney test, n = 40; 5 mice per experimental day and per genotype). Error bars represent S.D. See also Fig. S2. B, bone marrow analysis. Five erythroid populations from immature to mature (R1, R2, R3, R4, and R5) are distinguished by CD71 and TER119 expression levels in freshly isolated marrow by flow cytometry. Note that control samples D0 are characterized by a minor R2 and a large R5 population. During PH-induced acute marrow response D3, R5 disappears and R2 increases. At the recovery phase D6, R5 is restored. C and D, quantitative analysis of cell progression in acute marrow response D3. C, cumulative percentage at each erythroid population, i.e. R1 = R1; R2 = R1 + R2; R3 = R1 + R2 + R3 and so on. The curve represents both expansion and maturation throughout erythropoiesis. UCP2 KO mice are characterized by reduced expansion at the R2-R3 stage. D, statistical analysis of R3 population, not cumulative (p = 0.0040, two-tailed Student's t test).
FIGURE 3.
FIGURE 3.
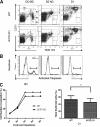
Kinetics of in vitro erythroid differentiation. C-KIT+ cells were isolated from bone marrow and were analyzed in a two stage in vitro differentiation assay. The first stage (0–24 h) was in the presence of EPO; the second stage (24–48 h) was in the absence of EPO (see “Experimental Procedures”). A, FACS dot plots as described in Fig. 2B. Cells were immunostained with fluorescein isothiocyanate-CD71 and phycoerythrin-TER119 to follow erythroid differentiation. D0 BD, day 0 of fresh whole marrow; D0 AD, day 0 of isolated C-KIT+ cells; D1, C-KIT+ cells cultured with EPO for 24 h. Note the propagation of cells from R2 to R3. B, analysis of apoptosis. Cells were stained with phycoerythrin-TER119 and FLICA (6-carboxyfluorescein-VAD-fluoromethyl ketone), a green fluorescent caspase substrate. No differences were found between the UCP2 KO and WT mice. C, quantitative analysis of cell progression. Left panel, cumulative percentage during the first 24 h (D1) at each erythroid population as described in Fig. 2C (n = 4). Note the same pattern of erythroid differentiation as compared with the marrow response (Fig. 2C). Right panel, statistical analysis of total erythroid cells (R1+R2+R3+R4+R5) at D1 (p = 0.0307, Student's t test).
FIGURE 4.
FIGURE 4.
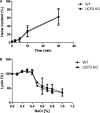
Effect of UCP2 on heme biosynthesis and RBC survival. A, 59Fe incorporation into the heme fraction in reticulocytes. Data were normalized against reticulocyte number per sample and radioactivity in the non-protein fraction. No significant differences were found in iron incorporation rate between the two genotypes. B, osmotic fragility test. Peripheral blood was collected and exposed to different concentration of NaCl (%) for 30 min at room temperature. Hemolysis was assessed by spectrometry of supernatant at 540 nm. Cell oxidative damage is expected to increase the resistance to the insult, i.e. to shift the curve toward the left. No significant differences were found.
FIGURE 5.
FIGURE 5.
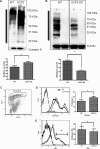
Effect of UCP2 on protein oxidation and ROS generation. A and B, analysis of oxidized protein in WT and UCP2 KO bone marrow samples. A, mitochondrial proteins. B, total cellular proteins. Samples were reacted with 2,4-dinitrophenylhydrazine to derivatize the protein carbonyl groups, which were then detected with an anti-2,4-dinitrophenol antibody after SDS-PAGE. +, positive derivatization; –, negative control of derivatization. Complex III and β-actin were used as loading control. Densitometry analysis was calculated by measuring all protein intensities along the left-side gray bar. Note that UCP2 KO is more oxidized at the mitochondria level (p = 0.0352, Student's t test) but surprisingly less at the total protein level (p = 0.0021, Student's t test) as compared with WT. C, D, and E, ROS generation by erythropoietic cells. Mitochondrial and cytosolic ROS were analyzed in bone marrow CD71+ erythroid cells selected by gating shown in C according to fluorescein isothiocyanate-CD71 antibody staining and Forward Scatter parameter (FSC-H) of bone marrow samples. D, superoxide levels inside mitochondria were determined by the mitochondrial superoxide probe, MitoSox (p = 0.0230, one-tailed Student's t test). E, cellular ROS levels were determined by dihydroethidium (DHE), which mainly identifies cytosolic superoxide radicals (p = 0.0314, one-tailed Student's t test). Dashed curves in C and D represent control unstained cells. Because of the low overall dihydroethidium fluorescence intensity, the M1 region was used for densitometry. Error bars represent S.D.
FIGURE 6.
FIGURE 6.
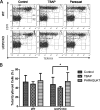
Effect of oxidative/reductive environment on the kinetics of in vitro erythroid differentiation. C-KIT+ cells isolated from bone marrow were cultured in the presence or absence of 40 μm TBAP (anti-oxidant; SOD2 mimetic) or 3 μm Paraquat (pro-oxidant) during the EPO-dependent phase (first 24 h). Samples were collected as described in Fig. 3 and immunostained with fluorescein isothiocyanate-CD71 and phycoerythrin-TER119 to follow erythroid differentiation by FACS. A, FACS dot plots at D1 as described in Fig. 2B under different culture conditions. Note that cell number in R2 and R3 is reduced in UCP2 KO as compared with WT under untreated (Control) conditions. TBAP inhibits progression from R2 to R3, indicated by the accumulation of cells in R2 in both genotypes. Treatment with paraquat resulted in the restoration of the reduced R2 and R3 populations of the UCP2 KO sample, whereas in WT it had comparatively little effect. B, quantification of the effect of TBAP and Paraquat on total erythroid cells. Paraquat treatment significantly increases the number of erythropoietic cells in UCP2 KO samples as compared with control (p = 0.0494, one-tailed T-Student). After treatment with paraquat, UCP2 KO cells show no significant differences as compared with untreated WT cells. (Control, n = 7; TBAP, n = 3; Paraquat n = 4). Error bars represent S.D.
FIGURE 7.
FIGURE 7.
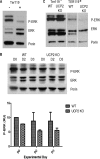
Effect of UCP2 on the levels of phosphorylated ERK in erythropoiesis. A, control levels of phosphorylated ERK 1/2 (or ERK 44/42) in WT bone marrow TER119 and TER119+ cells. Cells were isolated as described in Fig. 1. Note the decrease of P-ERK in Ter119+ cells, which is coincident to the onset of hemoglobinization. B, ERK phosphorylation response of UCP2 KO and WT mice to PH-induced hemolytic anemia during the acute marrow response. Mice were induced to undergo hemolytic anemia as described in Fig. 2. Whole bone marrow samples were collected at D0, D2, and D3 and analyzed by Western blot. For densitometry, P-ERK was normalized to both Porin and total ERK (see “Results”) and expressed in relative units (RU). UCP2 KO has significantly reduced levels of P-ERK (p = 0.0281, 2-way analysis of variance) at all time points. Error bars represent S.D. C, analysis of P-ERK during in vitro erythroid differentiation. TER119 cells were isolated from E13.5 fetal liver as described above and induced to differentiate for 24 h (EPO-dependent phase). Western blot analysis was performed on freshly isolated TER119 cells, and after 24 h in the presence of EPO, they differentiated into TER119+ cells. Upon induction of differentiation with EPO, P-ERK was reduced in both WT and UCP2 KO cells as we have seen in bone marrow (A). However, cells from UCP2 KO exhibited an enhanced reduction of P-ERK as compared with WT.

Similar articles

Cited by

References

    1. Sluse, F. E., Jarmuszkiewicz, W., Navet, R., Douette, P., Mathy, G., and Sluse-Goffart, C. M. (2006) Biochim. Biophys. Acta 1757 480–485 - PubMed
    1. Esteves, T. C., and Brand, M. D. (2005) Biochim. Biophys. Acta 1709 35–44 - PubMed
    1. Ricquier, D., Miroux, B., Larose, M., Cassard-Doulcier, A. M., and Bouillaud, F. (2000) Int. J. Obes. Relat. Metab. Disord. 24 Suppl. 2, 86–88 - PubMed
    1. Nicholls, D. G. (2006) Biochim. Biophys. Acta 1757 459–466 - PubMed
    1. Krauss, S., Zhang, C. Y., and Lowell, B. B. (2005) Nat. Rev. Mol. Cell Biol. 6 248–261 - PubMed

Publication types

MeSH terms