. 2008 Nov 7;283(45):30482-92.
doi: 10.1074/jbc.M803348200. Epub 2008 Aug 1.

Re-evaluating the roles of proposed modulators of mammalian target of rapamycin complex 1 (mTORC1) signaling

Affiliations

Re-evaluating the roles of proposed modulators of mammalian target of rapamycin complex 1 (mTORC1) signaling

Xuemin Wang et al. J Biol Chem. .

Abstract

Signaling through mammalian target of rapamycin complex 1 (mTORC1) is stimulated by amino acids and insulin. Insulin inactivates TSC1/2, the GTPase-activator complex for Rheb, and Rheb.GTP activates mTORC1. It is not clear how amino acids regulate mTORC1. FKBP38 (immunophilin FK506-binding protein, 38 kDa), was recently reported to exert a negative effect on mTORC1 function that is relieved by its binding to Rheb.GTP. We confirm that Rheb binds wild type FKBP38, but inactive Rheb mutants showed contrasting abilities to bind FKBP38. We were unable to observe any regulation of FKBP38/mTOR binding by amino acids or insulin. Furthermore, FKBP38 did not inhibit mTORC1 signaling. The translationally controlled tumor protein (TCTP) in Drosophila was recently reported to act as the guanine nucleotide-exchange factor for Rheb. We have studied the role of TCTP in mammalian TORC1 signaling and its control by amino acids. Reducing TCTP levels did not reproducibly affect mTORC1 signaling in amino acid-replete/insulin-stimulated cells. Moreover, overexpressing TCTP did not rescue mTORC1 signaling in amino acid-starved cells. In addition, we were unable to see any stable interaction between TCTP and Rheb or mTORC1. Accumulation of uncharged tRNA has been previously proposed to be involved in the inhibition of mTORC1 signaling during amino acid starvation. To test this hypothesis, we used a Chinese hamster ovary cell line containing a temperature-sensitive mutation in leucyl-tRNA synthetase. Leucine deprivation markedly inhibited mTORC1 signaling in these cells, but shifting the cells to the nonpermissive temperature for the synthetase did not. These data indicate that uncharged tRNA(Leu) does not switch off mTORC1 signaling and suggest that mTORC1 is controlled by a distinct pathway that senses the availability of amino acids. Our data also indicate that, in the mammalian cell lines tested here, neither TCTP nor FKBP38 regulates mTORC1 signaling.


Figures
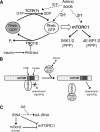
FIGURE 1.
FIGURE 1.
Models for the regulation of Rheb/mTORC1. A, guanine nucleotide-binding status of Rheb is likely controlled by its GAP (TSC1/2, which is inactivated by insulin signaling via Akt) and perhaps by its potential GEF, TCTP. Rheb·GTP activates mTORC1, which regulates the downstream effectors p70 S6K and 4E-BP1; phosphorylation of 4E-BP1 is more complex than shown, as different sites show differential sensitivity to rapamycin. Dashed arrows show ways in which amino acids might promote mTORC1 function, and: numbers refer to points made in the text. B, FKBP38 has been proposed to interact with mTOR/mTORC1 and inhibit its function. Binding of FKBP38 to Rheb·GTP is suggested to result in the release of FKBP38 from mTOR and activation of mTORC1 function. FRB denotes the FKBP12·rapamycin-binding domain of mTOR. C, deficiency of amino acids (AA) may lead to accumulation of uncharged tRNA. Either directly or via the activation of the protein kinase mGcn2, for example, this could lead to inhibition of mTORC1 function.
FIGURE 2.
FIGURE 2.
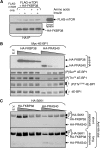
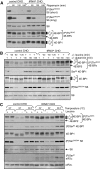
Wild type Rheb, but not the inactive C181S mutant, binds FKBP38 in a constitutive manner. A, HEK293 cells were transfected with vectors encoding FLAG-tagged Rheb or its C181S mutant and HA-tagged FKBP38. Cells were starved of serum overnight and, where indicated, treated with insulin (100 nm, 30 min). Cells were then lysed, and samples were either subjected to direct Western blot analysis (top section; using anti-FLAG) or to immunoprecipitation (IP) with anti-HA prior to SDS-PAGE/Western blot with anti-FLAG (middle section) and anti-HA (bottom section). Samples of cell lysate were analyzed in parallel in the middle and bottom sections. In the top section, the arrows indicate the slower migrating (nonfarnesylated) and faster migrating (farnesylated) forms of Rheb. B. HEK293 cells were transfected with vectors for wild type Rheb, the C181S mutant, or the empty vector. Twenty four hours later, cells were starved overnight for serum and, where shown (–), of amino acids for 60 min. Where indicated, cells were treated with insulin (100 nm for a further 30 min). Samples of cell lysate were analyzed by SDS-PAGE and Western blot using the indicated antisera. n.s. denotes a nonspecific band detected by anti-FLAG. The differentially phosphorylated forms of 4E-BP1 are indicated (α-γ). C, as A, but using wild type Rheb and the S20N mutant.E.V., empty vector. D, cells were transfected (with vectors for HA-FKBP38 and also FLAG-Rheb where indicated) and treated as in B. Samples of lysate were subjected to immunoprecipitation (IP) using anti-HA, and samples were analyzed by SDS-PAGE and Western blot using anti-FLAG and -HA, as indicated.
FIGURE 3.
FIGURE 3.
FKBP38 interacts with mTOR but does not inhibit mTORC1 signaling. A, HEK293 cells were transfected with vectors encoding FLAG-mTOR and HA-FKBP38 (or where indicated only with FLAG-mTOR). Twenty four hours later, cells were starved overnight for serum and, where shown (–) of amino acids for 60 min. Where indicated, cells were treated with insulin (for a further 30 min). Samples of lysate were subjected to immunoprecipitation (IP) with anti-HA, and the immunoprecipitates were analyzed by SDS-PAGE/Western blot with the indicated antibodies. A sample of lysate was run as a control on the anti-FLAG blot. B, HEK293 cells were transfected with a vector encoding Myc-tagged 4E-BP1 and varying amounts of vectors encoding HA-FKBP38 or HA-PRAS40 (or where indicated, with the empty vector, E.V.). Samples of cell lysate were analyzed by SDS-PAGE/Western blot with the indicated antibodies. The positions of the different species of 4E-BP1 are shown. C, HEK293 cells were transfected with a vector for HA-S6K1 and varying amounts of vectors encoding HA-FKBP38 or HA-PRAS40 (or where indicated, with the empty vector). Two differentially phosphorylated forms of p70 S6K1 (p, pp) are resolved on this gel system (the faster moving (less phosphorylated) of which runs just above HA-FKBP38, upper section). The lower section shows a longer exposure on which the signal for HA-PRAS40 is evident.
FIGURE 4.
FIGURE 4.
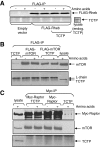
Probing the potential interactions of TCTP with Rheb, mTOR, or Raptor. A, HEK293 cells were transfected with vectors for untagged wild type TCTP and/or FLAG-Rheb (or empty vector). Forty hours later, the cells were lysed, and samples were immunoprecipitated with anti-FLAG (for Rheb). Immunoprecipitates were analyzed by Western blot using the indicated antibodies. Cell lysate was run as a positive control for the anti-TCTP antibody (right). B and C, HEK293 cells were transfected with vectors for TCTP and/or FLAG-tagged mTOR (B) or Myc-tagged raptor (C), as indicated. Forty hours later, cell lysates were prepared and subjected to immunoprecipitation (IP) with anti-FLAG (B) or anti-Myc (C). Samples were analyzed by SDS-PAGE and immunoblot using the indicated antisera. Samples of lysate were analyzed in parallel as positive controls.
FIGURE 5.
FIGURE 5.
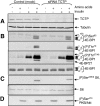
Knockdown of TCTP does not consistently affect the phosphorylation of S6 and 4E-BPs. HEK293 cells were transfected with siRNAs targeting TCTP or mock-transfected, as indicated. Cells were starved of serum and, where indicated, amino acids. In some cases, cells were treated with insulin (100 nm, 30 min). Cells were then lysed and, after normalizing protein content, samples were analyzed by Western blot using the indicated antibodies. A, immunoblots for TCTP and tubulin, as loading control.B, immunoblots for total 4E-BP1 and for specific phosphorylation sites, as indicated. The Thr(P)-37/46 phosphospecific antibody also appears to recognize the corresponding site(s) in 4E-BP2 (6). 4E-BP1 runs as three distinct species (α-γ), with γ being most highly phosphorylated. n.s. indicates nonspecific cross-reactions seen with these batches of antibodies. C, blots for S6 and for S6 phosphorylated at Ser-235/6. D, immunoblots for Akt phosphorylated at Ser-473.
FIGURE 6.
FIGURE 6.
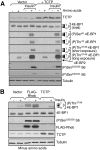
Overexpression of TCTP does not affect mTORC1 signaling. A, HEK293 cells were transfected with a vector encoding TCTP, Rheb or, as control, the empty vector. Cells were starved overnight of serum and, where indicated, also for amino acids. In some cases, cells were treated with insulin (100 nm, 30 min). Cells were lysed and samples analyzed by SDS-PAGE/Western blot using the indicated antibodies (with long and short exposures for 4E-BP1 Thr(P)-37/46). B, HEK293 cells were transfected with a vector encoding FLAG-Rheb or TCTP, or the empty vector as indicated. Cells were starved of serum and for amino acids. In some cases, cells were treated with insulin (100 nm, 30 min). Samples of cell lysates were analyzed by Western blot using the indicated antibodies. Tubulin was used as a loading control.
FIGURE 7.
FIGURE 7.
Regulation of mTORC1 signaling in control and mutant CHO cells. A, control (TR-3) and mutant (tsH1) CHO cells were treated with rapamycin (100 nm) for the indicated times at 34 °C. The cells were lysed, and samples were analyzed by SDS-PAGE and Western blot using the indicated antibodies. The differentially phosphorylated species of 4E-BP1 are indicated (α-γ). B, TR-3 and tsH1 cells were starved for leucine or glutamine for the indicated times at 34 °C. The cells were lysed and samples analyzed as in A. C, TR-3 and tSH1 cells were incubated at 34 or 39.5 °C. The period of leucine starvation or incubation at the higher temperature was 1 h. The cells were lysed and samples analyzed as in A. As a positive control for the effects of uncharged tRNA accumulation, these lysates were also analyzed for eIF2α and eIF2α phosphorylated on Ser-51.

Similar articles

Cited by

References

    1. Wullschleger, S., Loewith, R., and Hall, M. N. (2006) Cell 124 471–484 - PubMed
    1. Yang, Q., and Guan, K. L. (2007) Cell Res. 17 666–681 - PubMed
    1. Easton, J. B., and Houghton, P. J. (2006) Oncogene 25 6436–6446 - PubMed
    1. Lee, C. H., Inoki, K., and Guan, K. L. (2007) Annu. Rev. Pharmacol. Toxicol. 47 443–467 - PubMed
    1. Wang, X., and Proud, C. G. (2006) Physiol. (Bethesda) 21 362–369 - PubMed

Publication types

MeSH terms

Substances