The impact of microRNAs on protein output
- PMID: 18668037
- PMCID: PMC2745094
- DOI: 10.1038/nature07242
The impact of microRNAs on protein output
Abstract
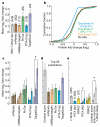
MicroRNAs are endogenous approximately 23-nucleotide RNAs that can pair to sites in the messenger RNAs of protein-coding genes to downregulate the expression from these messages. MicroRNAs are known to influence the evolution and stability of many mRNAs, but their global impact on protein output had not been examined. Here we use quantitative mass spectrometry to measure the response of thousands of proteins after introducing microRNAs into cultured cells and after deleting mir-223 in mouse neutrophils. The identities of the responsive proteins indicate that targeting is primarily through seed-matched sites located within favourable predicted contexts in 3' untranslated regions. Hundreds of genes were directly repressed, albeit each to a modest degree, by individual microRNAs. Although some targets were repressed without detectable changes in mRNA levels, those translationally repressed by more than a third also displayed detectable mRNA destabilization, and, for the more highly repressed targets, mRNA destabilization usually comprised the major component of repression. The impact of microRNAs on the proteome indicated that for most interactions microRNAs act as rheostats to make fine-scale adjustments to protein output.
Figures


Comment in
-
Small RNAs: The seeds of silence.Nature. 2008 Sep 4;455(7209):44-5. doi: 10.1038/455044a. Nature. 2008. PMID: 18769430 No abstract available.
-
Micrornas: making a big impression on the proteome.Nat Rev Genet. 2008 Sep;9(9):650. doi: 10.1038/nrg2435. Nat Rev Genet. 2008. PMID: 21491637 No abstract available.
Similar articles
-
Target identification of microRNAs expressed highly in human embryonic stem cells.J Cell Biochem. 2009 Apr 15;106(6):1020-30. doi: 10.1002/jcb.22084. J Cell Biochem. 2009. PMID: 19229866
-
Widespread changes in protein synthesis induced by microRNAs.Nature. 2008 Sep 4;455(7209):58-63. doi: 10.1038/nature07228. Epub 2008 Jul 30. Nature. 2008. PMID: 18668040
-
Mammalian microRNAs predominantly act to decrease target mRNA levels.Nature. 2010 Aug 12;466(7308):835-40. doi: 10.1038/nature09267. Nature. 2010. PMID: 20703300 Free PMC article.
-
Prediction of human microRNA targets.Methods Mol Biol. 2006;342:101-13. doi: 10.1385/1-59745-123-1:101. Methods Mol Biol. 2006. PMID: 16957370 Review.
-
Quantitative proteomic strategies for the identification of microRNA targets.Expert Rev Proteomics. 2012 Oct;9(5):549-59. doi: 10.1586/epr.12.49. Expert Rev Proteomics. 2012. PMID: 23194271 Review.
Cited by
-
Evaluating the performance of multi-omics integration: a thyroid toxicity case study.Arch Toxicol. 2024 Oct 23. doi: 10.1007/s00204-024-03876-2. Online ahead of print. Arch Toxicol. 2024. PMID: 39441382
-
Small interfering RNA-mediated translation repression alters ribosome sensitivity to inhibition by cycloheximide in Chlamydomonas reinhardtii.Plant Cell. 2013 Mar;25(3):985-98. doi: 10.1105/tpc.113.109256. Epub 2013 Mar 19. Plant Cell. 2013. PMID: 23512853 Free PMC article.
-
MicroRNA regulatory networks in human adipose tissue and obesity.Nat Rev Endocrinol. 2015 May;11(5):276-88. doi: 10.1038/nrendo.2015.25. Epub 2015 Mar 3. Nat Rev Endocrinol. 2015. PMID: 25732520 Review.
-
Association analysis of genetic variants in microRNA networks and gastric cancer risk in a Chinese Han population.J Cancer Res Clin Oncol. 2012 Jun;138(6):939-45. doi: 10.1007/s00432-012-1164-8. Epub 2012 Feb 17. J Cancer Res Clin Oncol. 2012. PMID: 22350505
-
Using microRNA as an alternative treatment for hyperlipidemia and cardiovascular disease: cardio-miRs in the pipeline.J Cardiovasc Pharmacol. 2013 Sep;62(3):247-54. doi: 10.1097/FJC.0b013e31829d48bf. J Cardiovasc Pharmacol. 2013. PMID: 23743768 Free PMC article. Review.
References
-
- Everley PA, et al. Enhanced analysis of metastatic prostate cancer using stable isotopes and high mass accuracy instrumentation. J. Proteome Res. 2006;5:1224–1231. - PubMed
-
- Kersey PJ, et al. The International Protein Index: an integrated database for proteomics experiments. Proteomics. 2004;4:1985–1988. - PubMed
-
- Pruitt KD, Katz KS, Sicotte H, Maglott DR. Introducing RefSeq and LocusLink: curated human genome resources at the NCBI. Trends Genet. 2000;16:44–47. - PubMed
Publication types
MeSH terms
Substances
Associated data
- Actions
Grants and funding
LinkOut - more resources
Full Text Sources
Other Literature Sources
Molecular Biology Databases

