. 2008 Oct 17;283(42):28380-91.
doi: 10.1074/jbc.M710465200. Epub 2008 Jul 29.

Quality control of photosystem II: reactive oxygen species are responsible for the damage to photosystem II under moderate heat stress

Affiliations

Quality control of photosystem II: reactive oxygen species are responsible for the damage to photosystem II under moderate heat stress

Amu Yamashita et al. J Biol Chem. .

Abstract

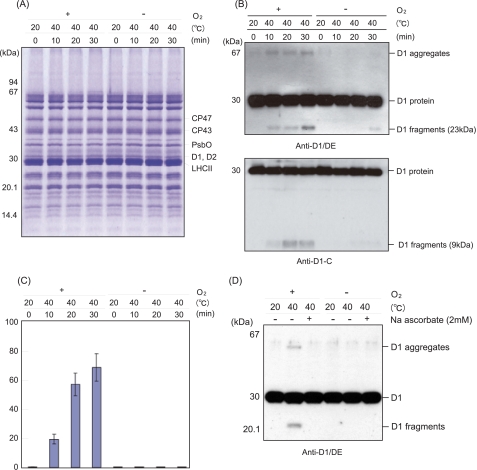
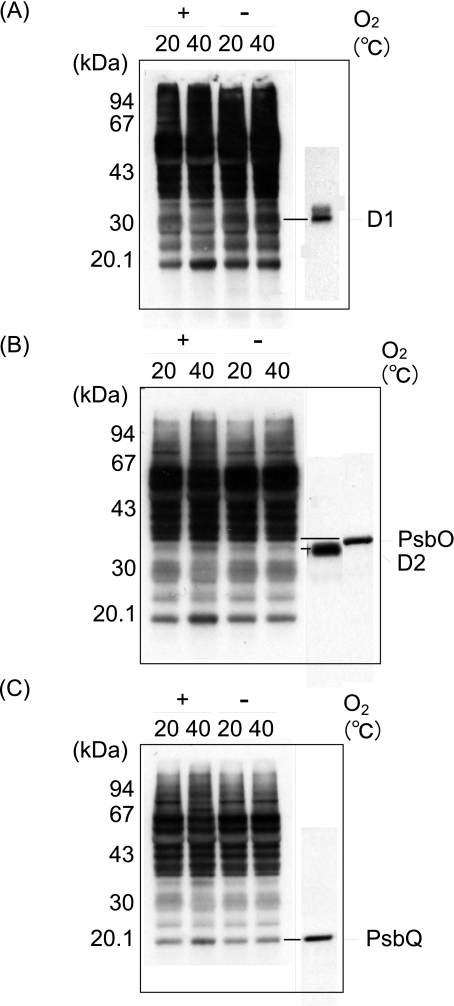
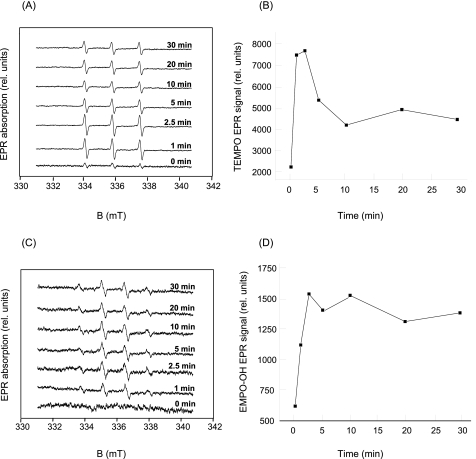
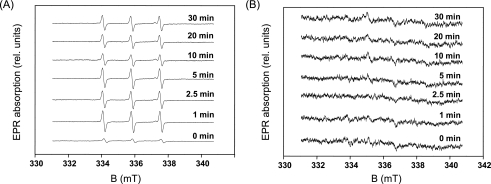
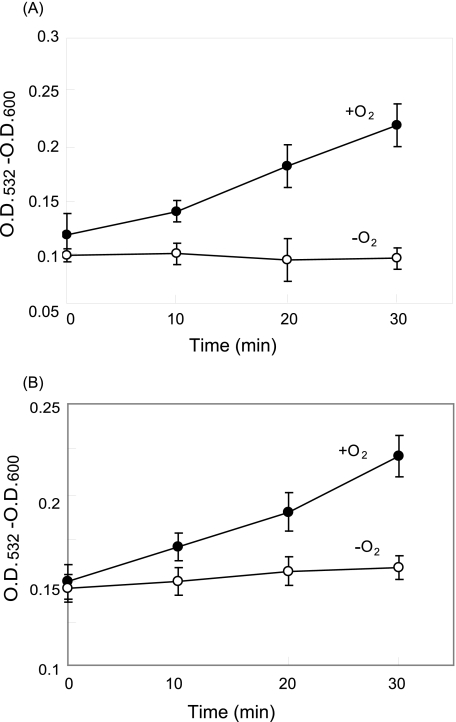
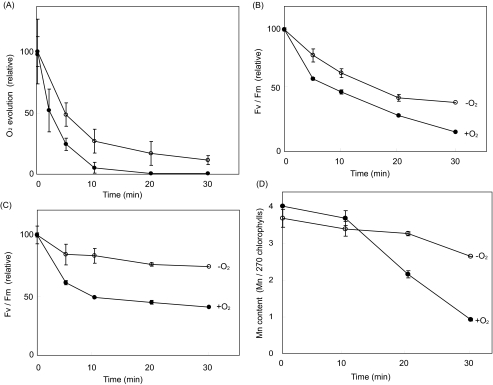
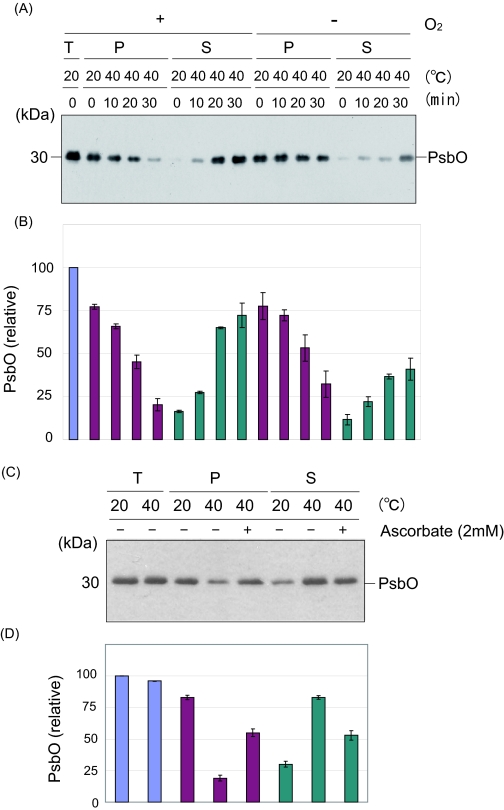
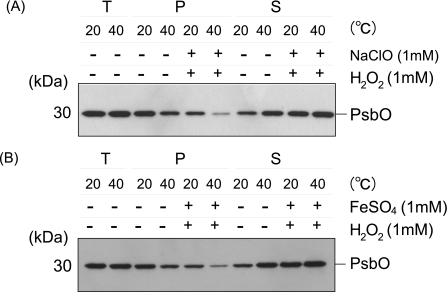
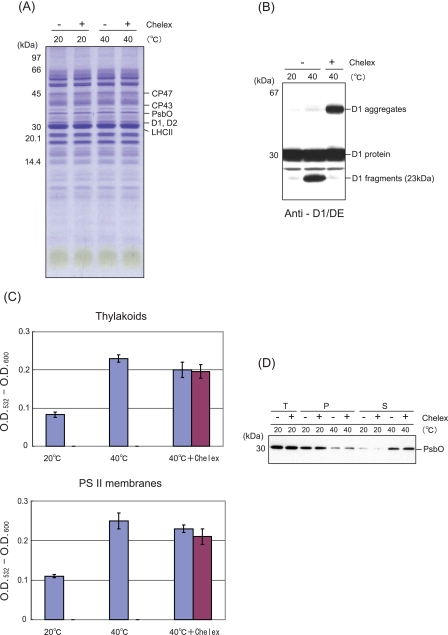
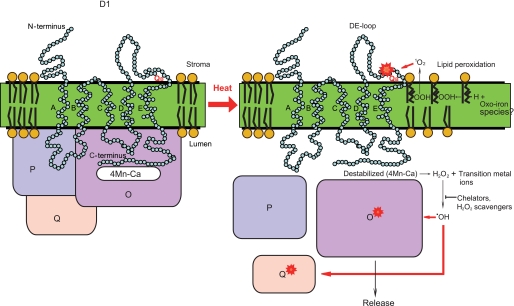
Moderate heat stress (40 degrees C for 30 min) on spinach thylakoid membranes induced cleavage of the reaction center-binding D1 protein of photosystem II, aggregation of the D1 protein with the neighboring polypeptides D2 and CP43, and release of three extrinsic proteins, PsbO, -P, and -Q. These heat-induced events were suppressed under anaerobic conditions or by the addition of sodium ascorbate, a general scavenger of reactive oxygen species. In accordance with this, singlet oxygen and hydroxyl radicals were detected in spinach photosystem II membranes incubated at 40 degrees C for 30 min with electron paramagnetic resonance spin-trapping spectroscopy. The moderate heat stress also induced significant lipid peroxidation under aerobic conditions. We suggest that the reactive oxygen species are generated by heat-induced inactivation of a water-oxidizing manganese complex and through lipid peroxidation. Although occurring in the dark, the damages caused by the moderate heat stress to photosystem II are quite similar to those induced by excessive illumination where reactive oxygen species are involved.


Figures

FIGURE 1.
FIGURE 1.
Cleavage and aggregation of the D1 protein from spinach thylakoid membranes induced by moderate heat stress under aerobic and anaerobic conditions. A, profile of the thylakoid proteins in SDS/urea-PAGE with Coomassie staining after heat treatment of the thylakoids at 40 °C for the indicated periods under the aerobic (+O2) and anaerobic (-O2) conditions. The control temperature is 20 °C. Molecular markers are shown on the left-hand side of the gel. The positions of several proteins of PS II are indicated on the right-hand side of the gel. B, Western blot analysis with the antibody against the DE-loop and the C-terminal part of the D1 protein, showing the profile of the D1 protein from the thylakoid membranes treated at 40 °C for the indicated periods. The positions of the molecular mass markers are on the left side, and those of the degradation fragments and the aggregates of the D1 protein are on the right-hand side of the gel. C, quantification of the 23-kDa degradation fragments of the D1 protein detected after heat treatment of the thylakoid membranes at 40 °C for the indicated periods under the aerobic (+O2) and anaerobic (-O2) conditions. The data are the average of three independent measurements ± S.D. D, effects of sodium ascorbate on the heat-induced cleavage and aggregation of the D1 protein. Sodium ascorbate (2 mm) was added before the heat treatment of the thylakoid membranes at 40 °C under both the aerobic and anaerobic conditions, and after SDS/urea-PAGE, Western blot analysis was carried out with the antibody against the DE-loop of the D1 protein.
FIGURE 2.
FIGURE 2.
Detection of oxidation of the proteins in the thylakoid membranes induced by moderate heat stress. Thylakoid membranes were heat-treated at 40 °C for 30 min under aerobic (+O2) and anaerobic (-O2) conditions, and the content of protein carbonyl was measured by an Oxi-Blot protein oxidation detection kit. The control temperature is 20 °C. A, fluorograms of Oxi-Blot (left) and of Western blot analysis with the antibody against the DE-loop of the D1 protein (right). B, fluorograms of Oxi-Blot (left) and of Western blot analysis with the antibody against the D2 and PsbO proteins (right). C, fluorograms of Oxi-Blot (left) and of Western blot analysis with the antibody against PsbQ. A–C, the same PVDF membranes with the thylakoid proteins blotted were exposed to x-ray films for different periods to clarify the differences in the degree of protein oxidation between the aerobic and anaerobic conditions, as well as between the stress temperature and the control conditions.
FIGURE 3.
FIGURE 3.
Detection of reactive oxygen species in the heat-treated PS II membranes. A, TEMPO EPR spectra measured in the PS II membranes heated at 40 °C for the periods indicated in the figure. TEMPO spectra were measured in the presence of 50 mm TEMP, 5% ethanol, 500 μg of chlorophyll ml-1, and 40 mm MES (pH 6.5). B, time profile of a TEMPO EPR signal measured in the PS II membranes heated at 40 °C. TEMPO EPR signal was determined as the relative height of the central peak of the first derivative of the absorption spectra. C, EMPO-OH adduct EPR spectra measured in the PS II membranes heated at 40 °C for the periods indicated in the figure. EMPO-OH spectra were measured in the presence of 75 μm EMPO, 500 μg of chlorophyll ml-1, and 40 mm MES (pH 6.5). D, time profile of EMPO-OH adduct EPR signal measured in the PS II membranes heated at 40 °C. EMPO-OH adduct EPR signal was determined as the relative height of the central doublet of the first derivative of absorption spectra. B and D, for longer periods of heat treatment, the spin trap-radical adduct EPR signals decline because of the instability of spin trap-radical adduct.
FIGURE 4.
FIGURE 4.
Effect of the removal of the water-splitting manganese complex on formation of reactive oxygen species in the heat-treated PS II membranes. A, TEMPO EPR spectra measured in the Tris-treated PS II membranes heated at 40 °C for the periods indicated in the figure. B, EMPO-OH adduct EPR spectra measured in the Tris-treated PS II membranes heated at 40 °C for the periods indicated in the figure. A and B, other experimental conditions were the same as those in Fig. 3, A and C, respectively.
FIGURE 5.
FIGURE 5.
Heat-induced lipid peroxidation in the thylakoid and PS II membranes estimated by the TBA test. A, thylakoid membranes. B, PS II membranes. Absorbance at 532 nm of the TBA·MDA complex was measured under the aerobic (closed circles) and anaerobic conditions (open circles) after incubation of the samples at 40 °C for the periods indicated. The concentration of chlorophyll in the reaction mixture was 1 mg ml-1 chlorophyll in A, and 0.1 mg ml-1 chlorophyll in B, respectively. The data are the average of three independent measurements ± S.D.
FIGURE 6.
FIGURE 6.
The effects of heat stress on PS II activity in the thylakoids and PS II membranes and on release of manganese from PS II. The samples were incubated at 40 °C for the periods indicated either under aerobic or anaerobic conditions. A, oxygen evolving activity in the thylakoids (closed circles) and PS II membranes (open circles). The samples were incubated at 40 °C under the aerobic conditions. 100% of the oxygen evolving activity corresponds to 91 μmol of O2 evolved mg-1 chlorophyll h-1 with the thylakoids and 311 μmol of O2 evolved mg-1 chlorophyll h-1 with the PS II membranes. The antenna size of the PS II preparation was assumed to be 270 chlorophylls, based on Ref. . B, Fv/Fm of chlorophyll fluorescence in the thylakoids under the aerobic (closed circles) or anaerobic (open circles) conditions. The 100% values under the aerobic and anaerobic conditions are 0.68 and 0.64, respectively. C, Fv/Fm of chlorophyll fluorescence in the PS II membranes under aerobic (closed circles) and anaerobic (open circles) conditions. The 100% values under the aerobic and anaerobic conditions correspond to 0.75 and 0.67, respectively. D, the content of manganese in the PS II membranes under the aerobic (closed circles) or anaerobic (open circles) conditions. All the data are the average of three measurements ± S.D.
FIGURE 7.
FIGURE 7.
Heat-induced release of the PsbO protein from PS II under the aerobic and anaerobic conditions and the effects of addition of sodium ascorbate on the protein release. A, heat-induced release of the PsbO protein from the PS II membranes under the aerobic (left) and anaerobic (right) conditions. The samples were incubated at 40 °C for the periods indicated. T, P, and S represent the total PS II membranes, the precipitate, and the supernatant of centrifugation after heat treatment of the PS II membranes, respectively. The positions of PsbO and molecular markers are shown on the right and left side of the gel, respectively. B, estimation of the amounts of PsbO in each fraction shown in A. The data are the average of three independent measurements ± S.D. The blue, purple, and cyan bars represent the amount of PsbO protein in the total PS II membranes, the precipitate, and the supernatant of centrifugation after heat treatment of the PS II membranes. C, effects of sodium ascorbate (2 mm) on the release of the PsbO protein from the PS II membranes under heat stress at 40 °C for 30 min. Sodium ascorbate was added prior to the heat treatment where indicated. D, estimation of the amounts of PsbO in each fraction shown in C. The data are the average of three independent measurements ± S.D. The colors of the bars represent the same as those in B.
FIGURE 8.
FIGURE 8.
Release of the PsbO from PS II by the addition of artificially produced reactive oxygen species. A, 1O2 was chemically produced by the addition of 1 mm NaClO and 1 mm H2O2. B, HO· was generated through the Fenton reaction by the addition of 1 mm H2O2 and 1 mm FeSO4. The effects of the ROS were assayed by incubation of the PS II membranes with the ROS generating solution for 30 min both at 20 and 40 °C. The positions of PsbO and the molecular markers are shown on the right and left side of the gel, respectively.
FIGURE 9.
FIGURE 9.
Effects of moderate heat stress on the thylakoids and PS II membranes that had been pretreated with Chelex. A, profile of the proteins in the Chelex-treated thylakoids shown by Coomassie Blue staining of the SDS/urea-PAGE gel. The thylakoids with (+) or without (-) Chelex treatment were incubated at either 20 or 40 °C for 30 min. The positions of molecular mass markers are shown at the left-hand side of the gel, and several PS II proteins at the right-hand side of the gel, respectively. B, effects of heat stress on the D1 protein in the thylakoids with (+) or without (-) Chelex treatment. Heat stress was given at 40 °C for 30 min. The bands of the D1 fragments and aggregates are shown at the right-hand side of the gel. C, effects of heat stress on the lipid peroxidation in the thylakoids and the PS II membranes with and without Chelex treatment. Lipid peroxidation was measured as described in the legend to Fig. 5. Where indicated, the samples were treated with Chelex once or twice (shown as blue and red bars, respectively), and then subjected to heat stress at 40 °C for 30 min. D, effects of heat stress on the PsbO protein in the PS II membranes with and without Chelex treatment. T, P, and S at the top of the gel represent the total protein, the pellet, and the supernatant of the centrifugation after incubation at 20 or 40 °C for 30 min, respectively.
FIGURE 10.
FIGURE 10.
A model for the effects of moderate heat stress on PS II. At the acceptor side of PS II, heat-induced lipid peroxidation produces 1O2, which damages the DE-loop of the D1 protein and causes cleavage as well as aggregation of the D1 protein. At the donor side of PS II, heat induces destabilization of the four manganese-calcium cluster and generates H2O2. The H2O2 then reacts with transition metal ions to produce OH·, which in turn damages proteins, including D1 and D2 and the extrinsic PsbO and Q proteins. The extrinsic proteins are probably released from PS II after damage takes place in the D1 protein.

Similar articles

Cited by

References

    1. Kyle, D. J., Ohad, I., and Arntzen, C. J. (1984) Proc. Natl. Acad. Sci. U. S. A. 81 4070-4074 - PMC - PubMed
    1. Ohad, I., Kyle, D. J., and Arntzen, C. J. (1984) J. Cell Biol. 270 14919-14927 - PMC - PubMed
    1. Barber, J., and Andersson, B. (1992) Trend Biochem. Sci. 17 61-66 - PubMed
    1. Aro, E.-M., Virgin, I., and Andersson, B. (1993) Biochim. Biophys. Acta 1143 113-134 - PubMed
    1. Andersson, B., and Aro, E.-M. (1997) Physiol. Plant. 100 780-793

Publication types

LinkOut - more resources