
Autoregulation of Th1-mediated inflammation by twist1

Uwe Niesner et al. J Exp Med. .

Abstract

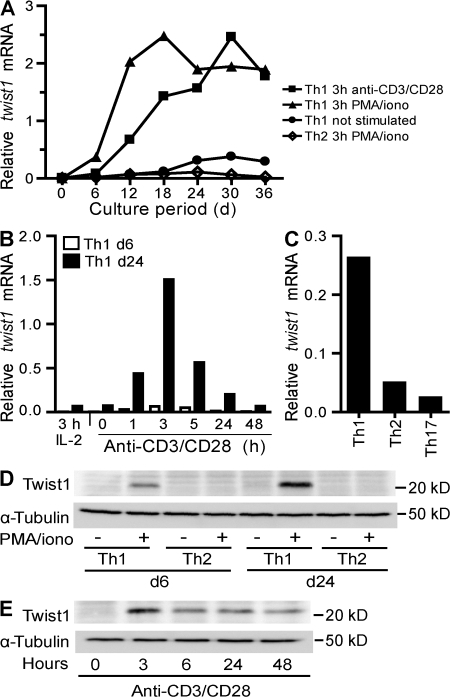
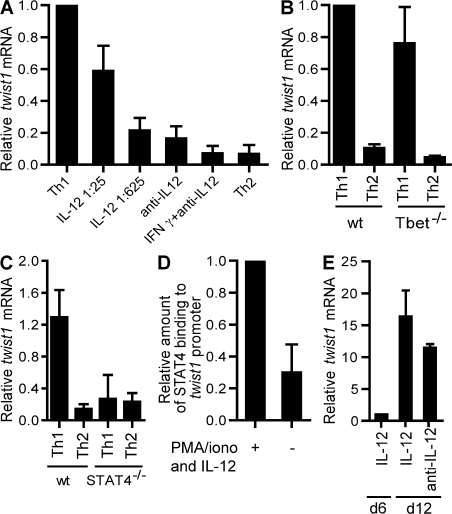
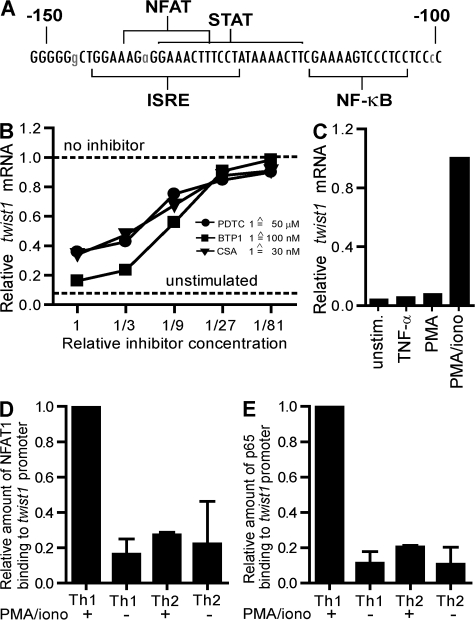
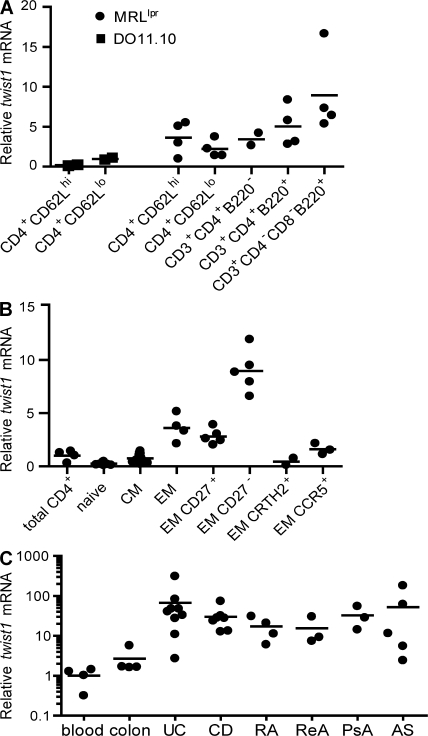
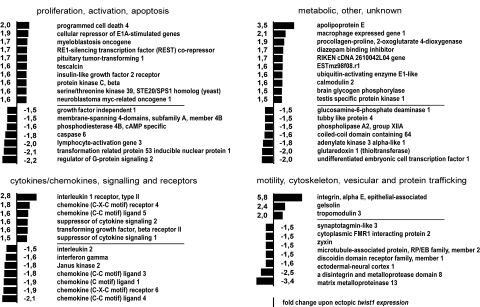
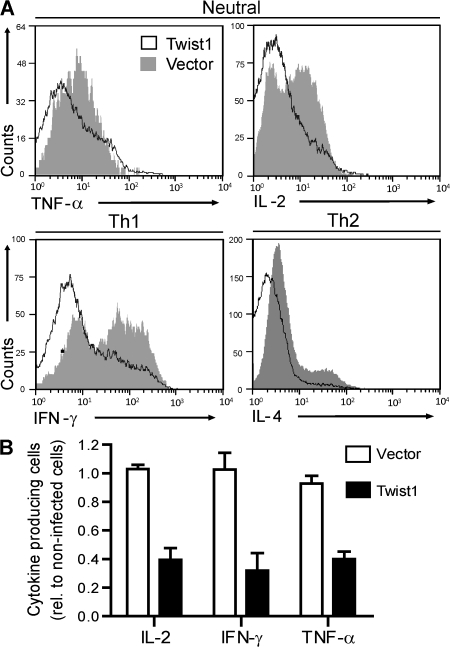
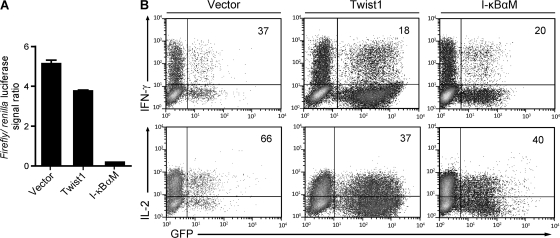
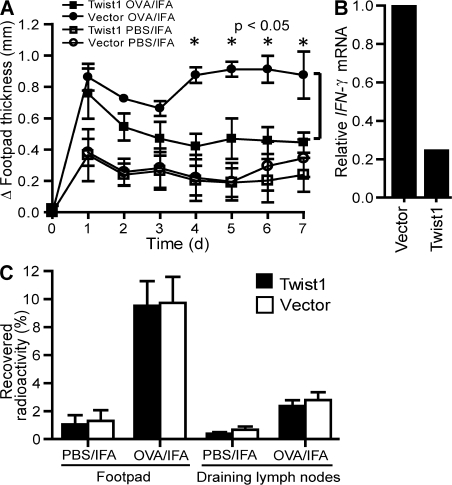
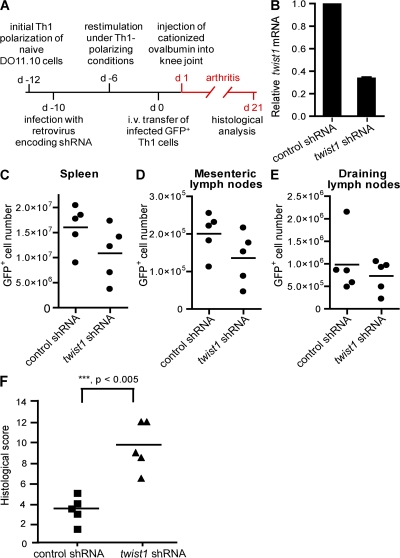
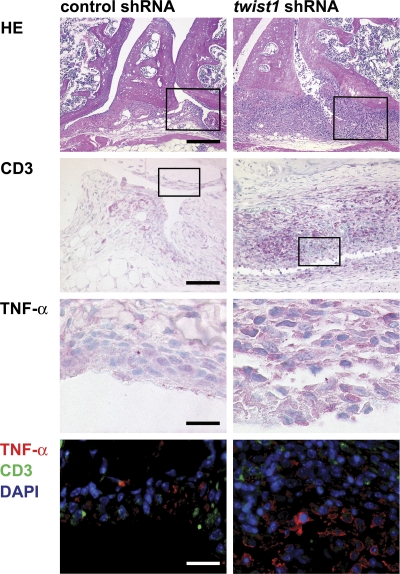
The basic helix-loop-helix transcriptional repressor twist1, as an antagonist of nuclear factor kappaB (NF-kappaB)-dependent cytokine expression, is involved in the regulation of inflammation-induced immunopathology. We show that twist1 is expressed by activated T helper (Th) 1 effector memory (EM) cells. Induction of twist1 in Th cells depended on NF-kappaB, nuclear factor of activated T cells (NFAT), and interleukin (IL)-12 signaling via signal transducer and activator of transcription (STAT) 4. Expression of twist1 was transient after T cell receptor engagement, and increased upon repeated stimulation of Th1 cells. Imprinting for enhanced twist1 expression was characteristic of repeatedly restimulated EM Th cells, and thus of the pathogenic memory Th cells characteristic of chronic inflammation. Th lymphocytes from the inflamed joint or gut tissue of patients with rheumatic diseases, Crohn's disease or ulcerative colitis expressed high levels of twist1. Expression of twist1 in Th1 lymphocytes limited the expression of the cytokines interferon-gamma, IL-2, and tumor necrosis factor-alpha, and ameliorated Th1-mediated immunopathology in delayed-type hypersensitivity and antigen-induced arthritis.


Figures

Figure 1.
Figure 1.
Twist1 expression is induced in Th1, but not Th2 or Th17 cells. CD4+CD62Lhi OVA-specific T lymphocytes were stimulated in vitro under Th1 or Th2, or under Th17-polarizing conditions. Functional polarization of Th1, Th2, and Th17 cells, i.e., the cytokine expression profile, was confirmed by intracellular immunofluorescence (Fig. S1). (A) Twist1 mRNA in resting cells 6 d after the last stimulation (Th1; circles) or after 3 h of restimulation with anti-CD3/CD28 and IL-2 (Th1; squares) or PMA/ionomycin and IL-2 (Th1; triangles: Th2; diamonds) was determined by RT-PCR and normalized to hypoxanthine guanine phosphoribosyl transferase (HPRT). (B) Kinetics of twist1 mRNA expression in 6-d-old (open bars) and 24-d-old (shaded bars) Th1 cells, after stimulation with anti-CD3/CD28 and IL-2 or IL-2 alone. (C) Twist1 transcript levels in 6-d-old Th1, Th2, and Th17 cells after reactivation with PMA/ionomycin. (D) Twist1 protein expression in resting (-) and 5 h PMA/ionomycin-restimulated (+) 6- and 24-d-old Th1 and Th2 cells. Control: α-Tubulin immunoblot (bottom). (E) Kinetics of Twist1 protein expression in 24-d-old Th1 cells, before and at the indicated time intervals of stimulation with anti-CD3/CD28 and IL-2. Data are representative of two experiments. Fig. S1 is available at http://www.jem.org/cgi/content/full/jem.20072468/DC1.
Figure 2.
Figure 2.
Twist1 induction requires IL-12 signaling via STAT4, but not IFN-γ or T-bet. (A) CD62Lhi DO11.10 Th cells were stimulated for 5 d under Th1-polarizing conditions (5 ng/ml IL-12, anti-IL4), reduced IL-12 (1/25:200 pg/ml; 1/625:8 pg/ml, anti-IL4), in the absence of IL-12 (anti–IL-12, anti-IL4), in the presence of IFN-γ (10 ng/ml IFN-γ, anti-IL-12, anti-IL-4), or under Th2-polarizing conditions. Twist1 mRNA in Th cells activated for 3 h with PMA/ionomycin and IL-2 was quantified by RT-PCR. The amount of twist1 transcripts induced under Th1-polarizing conditions was set to 1. Data are presented as the mean ± the SD of at least three experiments. (B) CD62Lhi Th cells of T-bet−/− mice and syngenic BALB/c mice were stimulated with anti-CD3/CD28 and BALB/c APCs under Th1 (IL-12 and IFN-γ), or under Th2-polarizing conditions for 6 d. Data represent the mean ± the SD of three experiments. The amount of twist1 transcripts induced in activated wt Th1 cells was set to 1. (C) CD4+ cells of STAT4−/− and syngenic BALB/c mice were stimulated with anti-CD3/CD28, and BALB/c APCs under Th1 (IL-12 and IFN-γ) or under Th2-polarizing conditions for 5 d. Data represent the mean ± SD (four mice each). (D) The binding of STAT4 to the proximal promoter of twist1 was analyzed by ChIP. 6-d-old Th1 cells were restimulated with PMA/ionomycin in the presence of 10 ng/ml IL-12 for 3 h or left unstimulated. The immunoprecipitated DNA was quantified by RT-PCR using primers specific for the proximal twist1 promoter. The precipitated DNA was normalized to the amount of input DNA. The amount of twist1 transcripts precipitated in the presence of IL-12 was set to 1. Data represent the mean ± SD of three experiments. (E) Naive DO11.10 Th cells were stimulated for 5 d with APCs and OVA327-339 under Th1-polarizing conditions. Cells were restimulated under the same conditions (Th1), or in the presence of anti–IL-12. Twist1 transcripts were quantified on d 11. The amount of twist1 mRNA on d 5 was set to 1. Data represent mean ± SD of three experiments.
Figure 3.
Figure 3.
Signaling through NFAT and NF-κB is required for induction of twist1 expression. (A) Comparison of the genomic sequence of the murine and the human proximal twist1 promoter (−150 to −100). The murine sequence is displayed with conserved bases in capital letters. Selected putative DNA-binding motifs are indicated. ISRE, IFN-stimulated response element. (B) Twist1 mRNA in 24-d-old Th1 cells restimulated for 3 h with PMA/ionomycin and IL-2 in the presence of serial dilutions of the NF-κB inhibitor pyrrolidine dithiocarbamate (PDTC; circles; starting concentration 50 μM), the NFAT inhibitor BTP1 (squares; starting concentration 100 nM), or the NF-κB and NFAT inhibitor cyclosporine A (CsA; triangles; starting concentration 30 nM). (C) 24-d-old Th1 cells were restimulated in the presence of IL-2 for 3 h with IL-2 alone (unstimulated) or 10 ng/ml TNF-α, PMA, or PMA/ionomycin. The binding of NFAT1 (D) and the NF-κB subunit p65 (E) to the proximal promoter of twist1 was analyzed by ChIP. 18–24-d-old Th1 and Th2 cells either in the resting state (-) or after restimulation with PMA/ionomycin and IL-2 for 1 h (+) were used. The immunoprecipitated DNA was quantified by RT-PCR using primers specific for the proximal promoter. The precipitated DNA was normalized to the amount of input DNA. The amount of twist1 transcripts precipitated in activated Th1 cells was set to 1. Data represent mean ± SD of 3 experiments.
Figure 4.
Figure 4.
Ex vivo isolated memory Th cells express twist1. Cells were sorted by flow cytometry and restimulated for 3 h with PMA/ionomycin (A–C). (A) Cells were isolated from the spleen and lymph nodes of 8–12-wk-old DO11.10 mice (squares, each representing a pool of 15 individual mice) and the pooled inguinal and mesenteric lymph nodes of 4–6-mo-old nephritic MRL/lpr mice (circles, 1–2 mice each). Of note: 90% of the CD4+CD62Lhi cells in MRL/lpr mice represented activated (CD44+) cells (not depicted). (B) Twist1 mRNA in peripheral human Th lymphocytes. The mean expression of twist1 mRNA normalized to ubiquitin ligase H5 in total CD3+CD4+ cells was set to 1. Subpopulations were defined according to expression of the following surface markers: naive (CD4+CD45RA+CCR7+), CM (CD4+CD45RACCR7+), EM (CD4+CD45RACCR7) with each data point representing one individual healthy donor. (C) Twist1 transcripts in CD3+CD4+ cells purified from patient material: blood (total peripheral CD3+CD4+ cells from healthy donors, see B), colon (noninflamed colon tissue), UC, and CD (endoscopic biopsies from UC and CD patients, respectively), RA, ReA, PsA, and AS (synovial fluid from rheumatoid arthritis, reactive arthritis, psoriatic arthritis, and ankylosing spondylitis patients, respectively) with each dot representing one individual patient. Mean twist1 mRNA expression is displayed from patients who were repeatedly sampled.
Figure 5.
Figure 5.
Genes differentially expressed upon ectopic twist1 overexpression. Splenic DO11.10 cells were activated in vitro with the cognate peptide OVA327-339 in the presence of 1 ng/ml IL-12 and 1 ng/ml IL-2. On d 2, cells were infected with control retrovirus, or twist1-encoding virus. On d 5, cells were sorted according to expression of the viral marker gene gfp. Cells were restimulated for 4 h with PMA/ionomycin. The transcriptional profiles of duplicates of cultures were compared.
Figure 6.
Figure 6.
Twist1 suppresses the expression of effector cytokines. DO11.10 Th cells were stimulated for 5 d under Th1- or Th2-polarizing conditions or without addition of cytokines. On d 2, cells were infected with control virus or twist1-encoding virus. The cells were restimulated on d 6 and stained for intracellular cytokine expression. (A) Representative histograms of cytokine expression in Th cells ectopically expressing twist1 (black line) and control cells (gray filled). The cells displayed were gated for expression of CD4 and the viral marker gene gfp. (B) Frequencies of cytokine-expressing cells among infected, i.e., GFP+CD4+ T cells relative to the noninfected CD4+ cells. Cells had been stimulated without addition of cytokines and infected with control virus (open bars) or twist1-encoding virus (filled bars). Data represent the mean ± SD of four independent experiments.
Figure 7.
Figure 7.
Inhibition of NF-κBmediated signaling by twist1 is promoter-specific. DO11.10 Th cells were stimulated with OVA327-339, APCs, and 1 ng/ml IL-12. On d 2, cells were infected with control virus, twist1, or I-κBαM-encoding virus. On d 3, cells were nucleoporated with a mixture of a plasmid encoding Renilla luciferase, and a firefly luciferase reporter construct, driven by a NF-κB–responsive promoter (4xκB-luc). (A) Cells were restimulated with PMA/ionomycin for 6 h, sorted according to expression of the viral marker gene gfp, and luciferase signals were quantified in duplicates (mean ± SD). (B) The very same Th1 cultures were restimulated on d 5 and stained for intracellular cytokine expression. Frequencies of cytokine-expressing cells among infected, i.e., GFP+CD4+ T cells, are displayed. Data are representative of two experiments.
Figure 8.
Figure 8.
Ectopic twist1 overexpression controls DTH. (A) Naive DO11.10 Th cells were stimulated under Th1-polarizing conditions. On d 2, cells were infected with control virus (circles) or twist1-encoding virus (squares). On d 6, infected GFP+ cells were injected i.v. into BALB/c mice. The DTH response was induced by s.c. OVA323-339/IFA injection into the left footpad (filled symbols), and Δ footpad thickness (mean ± SD; n = 4, Mann-Whitney test, nonparametric) was determined thereafter. Injection of PBS/IFA served as control (open symbols). (B) Ex vivo IFN-γ mRNA expression in transferred GFP+ Th1 cells 24 h after DTH induction isolated from the draining popliteal lymph node (left foot). (C) To monitor the migratory capacity of the transferred cell populations, infected GFP+ Th cells were radiolabeled and injected i.v. into BALB/c mice 1 d after induction of the DTH response. 24 h later radioactivity recovered from indicated tissues was determined using a γ-counter (mean ± SD; n = 4).
Figure 9.
Figure 9.
Twist1 knockdown increases inflammatory response in murine arthritis. (A) Experimental scheme. (B) Twist1 mRNA in 18-d-old Th1 expressing twist1-targeting shRNA or control shRNA restimulated with PMA/ionomycin. (C–E) Cell numbers of adoptively transferred GFP+ Th cells in spleen, mesenteric lymph nodes, and draining lymph nodes were analyzed on d 21 using FlowCount Beads. (F) Transfer of Th1 cells expressing a twist1-targeting shRNA leads to a significantly higher histological score in murine arthritis compared with control Th1 cells (d 21). Data are representative of two experiments.
Figure 10.
Figure 10.
Twist1 knockdown leads to pronounced signs of chronic inflammation in murine arthritis. Representative hematoxylin/eosin staining of knee joint sections (d 21) showing hyperplasia of the lining cells and the subintimal layer with pannus formation (bar, 200 μm), more pronounced infiltration of CD3+ T cells (magnification of boxed areas in top row; bar, 100 μm) and stronger expression of TNF-α (red) especially of the enlarged lining and sublining layer (magnification of boxed areas in second row; bar, 50 μm) after transfer of Th1 cells expressing a twist1-targeting shRNA as compared with the control group. Data are representative of five mice each.

Similar articles

Cited by

References

    1. Thisse, B., M. el Messal, and F. Perrin-Schmitt. 1987. The twist gene: isolation of a Drosophila zygotic gene necessary for the establishment of dorsoventral pattern. Nucleic Acids Res. 15:3439–3453. - PMC - PubMed
    1. Chen, Z.F., and R.R. Behringer. 1995. Twist is required in head mesenchyme for cranial neural tube morphogenesis. Genes Dev. 9:686–699. - PubMed
    1. Yang, J., S.A. Mani, J.L. Donaher, S. Ramaswamy, R.A. Itzykson, C. Come, P. Savagner, I. Gitelman, A. Richardson, and R.A. Weinberg. 2004. Twist, a master regulator of morphogenesis, plays an essential role in tumor metastasis. Cell. 117:927–939. - PubMed
    1. Sosic, D., J.A. Richardson, K. Yu, D.M. Ornitz, and E.N. Olson. 2003. Twist regulates cytokine gene expression through a negative feedback loop that represses NF-kappaB activity. Cell. 112:169–180. - PubMed
    1. Sharif, M.N., D. Sosic, C.V. Rothlin, E. Kelly, G. Lemke, E.N. Olson, and L.B. Ivashkiv. 2006. Twist mediates suppression of inflammation by type I IFNs and Axl. J. Exp. Med. 203:1891–1901. - PMC - PubMed

Publication types

MeSH terms