. 2008 Nov 15;95(10):4560-9.
doi: 10.1529/biophysj.108.135061. Epub 2008 Jul 25.

Monte carlo simulations of protein assembly, disassembly, and linear motion on DNA

Affiliations

Monte carlo simulations of protein assembly, disassembly, and linear motion on DNA

Thijn van der Heijden et al. Biophys J. .

Abstract

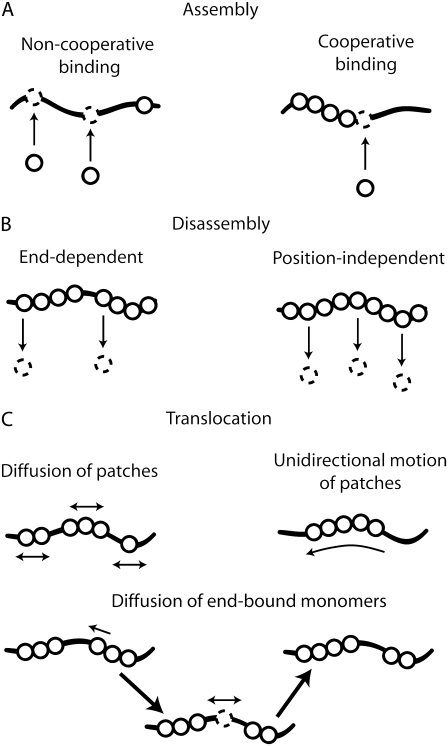
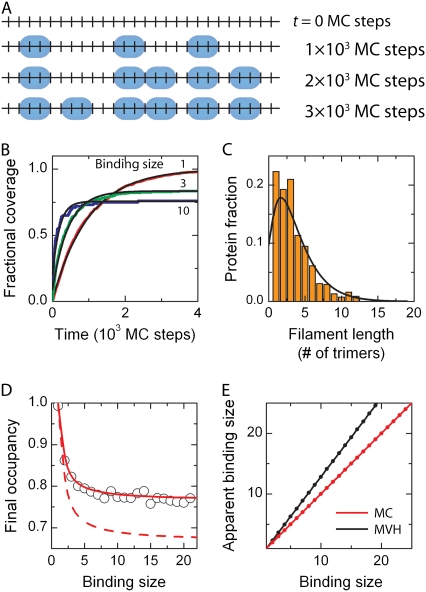
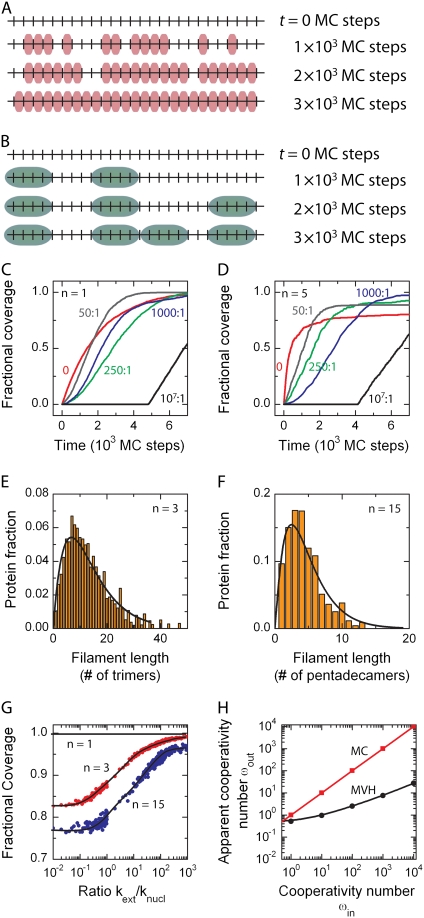
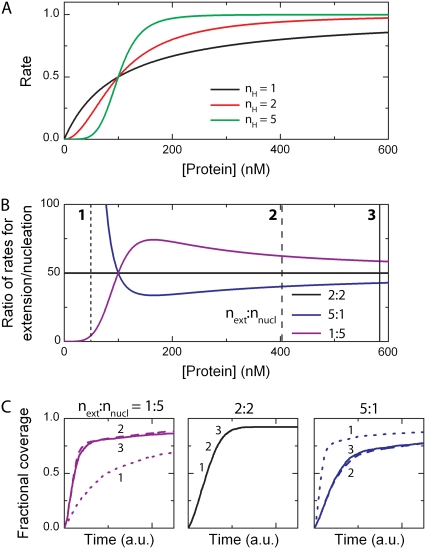
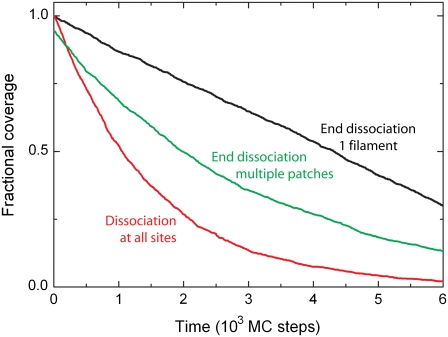
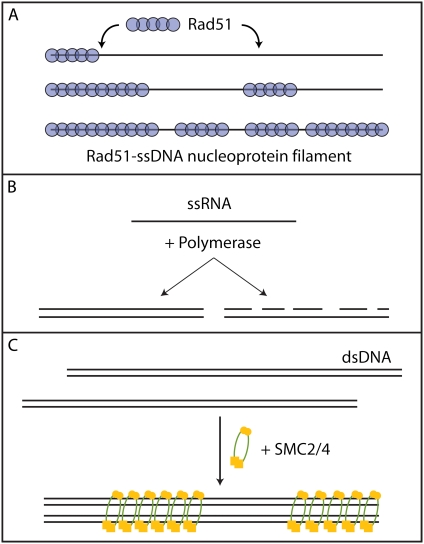
We use Monte Carlo simulations to analyze the simultaneous interactions of multiple proteins to a long DNA molecule. We study the time dependence of protein organization on DNA for different regimes that comprise (non)cooperative sequence-independent protein assembly, dissociation, and linear motion. A range of different behaviors is observed for the dynamics, final coverage, and cluster size distributions. We observe that the DNA substrate is almost never completely covered by protein when taking into account only (non)cooperative binding, because gaps remain on the substrate that are smaller than the binding site size of the protein. Due to these gaps, the apparent binding size of a protein during noncooperative binding can be overestimated by up to 30%. During dissociation of cooperatively bound proteins, the dissociation curve can be exponentially shaped even when allowing only end-dependent dissociation. We discuss the potential of our method for the analysis of a number of single-molecule experiments, for example, the binding of the DNA-repair proteins RecA and Rad51 to DNA.


Figures

FIGURE 1
FIGURE 1
Schematic drawings of different pathways for protein-DNA kinetics. (A) Assembly of a nonspecifically binding protein on its DNA substrate can be divided into two modes, noncooperative and cooperative. In the former (left panel), the protein binds randomly, whereas, in the latter (right panel), a preference exists to bind next to an already bound protein. (B) Disassembly of bound proteins can also be divided into two different modes, end-dependent and position-independent dissociation. In the first case (left), only proteins located at the end of a protein complex can dissociate, whereas, in the second case (right), all bound proteins, regardless of their position within the protein complex, have the same probability to dissociate. (C) Linear motion of a protein patch can be described by either a diffusive (left) or a unidirectional (right) mode. In the mode depicted at the bottom of the panel, end-bound monomers are allowed to detach from a protein patch and move diffusively toward a neighboring protein patch.
FIGURE 2
FIGURE 2
Noncooperative binding. (A) Snapshots of the DNA occupation by proteins at different times during a Monte Carlo simulation for noncooperative protein binding. This simulation is carried out for k = 5 × 10⁻⁶ site−1 (MC step)−1. As a protein covers 3 nt or 3 bp upon binding, binding can only occur if sufficient space is available. In the bottom panel, the simulation has reached its final state since no further proteins can bind. Gaps of 1 or 2 nt/bp are clear. (B) Time-dependent binding profiles are simulated for different binding sizes, i.e., n = 1, 3, and 10 (respectively red, green, and blue lines), showing an exponentially shaped growth curve (red line). Only for n = 1, full coverage is obtained. (C) The protein-patch length distribution of bound proteins in the saturated state has a maximum around a dimeric protein-patch length. The solid black line denotes the fit of Eq. 6 yielding a cooperativity number of 1.0 ± 0.3. (D) After protein coverage has saturated, the final occupancy of the substrate was determined. With increasing binding site size of the protein, the final occupancy decreased and finally reaches a plateau of ∼76%. The dependence is quite well described by Eq. 5 (red line). The dashed red line indicates the dependence when the gap size corresponds to formula image which clearly fails to describe the data. (E) The apparent binding site size of the protein can deviate from the actual binding site size due to the existence of gaps between bound proteins. In the Monte Carlo simulations the apparent binding site size is equivalent to the real size (red line). The obtained values in the MVH model overestimate the actual value by ∼30% (black line).
FIGURE 3
FIGURE 3
Cooperative binding. (A) Snapshots of the DNA occupation by protein at different times during a Monte Carlo simulation for cooperative protein binding. This simulation is carried out for knucl = 1 × 10⁻⁶ site−1 (MC step)−1, kext = 5 × 10⁻⁵ (MC step)−1, and a binding size n = 1. Due to the fast nucleation rate, multiple protein patches are formed along the DNA substrate. Because the protein covers only a single nucleotide or basepair, the final state (bottom panel) is a fully saturated lattice. (B) For a binding size >1, here n = 5, a similar intermediate state is observed for equivalent binding rates, but the final state contains gaps since no further proteins can bind. (C) Time-dependent lattice occupancy profiles are obtained from the simulations for different levels of cooperativity. If only random binding (nucleation) occurs along the contour length of the DNA molecule (noncooperative binding; see top left), an exponential lattice occupancy profile is obtained. However, if protein-patch extension is fast compared to nucleation, e.g., for a ratio >106 (strong cooperative binding; see bottom right), the lattice occupancy profile becomes linear and the molecule can be fully covered by the protein. For intermediate ratios between protein-patch extension and nucleation, sigmoidally shaped lattice occupancy profiles are observed. All lattice occupancy profiles reach complete saturation because the binding site size of the protein is one nucleotide or basepair in this case. (D) For n = 5 a similar change in binding profiles is observed, but complete saturation is not obtained. (E) The protein patch-length distribution for a protein with a binding-site size of three nucleotides or basepairs at a cooperativity number of ωin = 100. The solid line denotes the best fit obtained with Eq. 6, yielding a cooperativity ωout of 2.3 ± 0.3. (F) Similar scheme, but for a protein with a binding site size of 15 nucleotides or basepairs, yielded a cooperativity number of 10.8 ± 1.0 using Eq. 6. (G) Final occupancy of the substrate for varying numbers of cooperativity. If the binding site size is one nucleotide or basepair, full coverage is always obtained. For larger binding site sizes, the final occupancy increases with the applied cooperativity number approaching the full 100% at very high kext/knucl. (H) Apparent cooperativity number ωout versus actual cooperativity number ωin. For varying cooperativity numbers (ωin), the protein patch-length distribution is determined for n = 3. Subsequently, the simulated distributions are fit with Eq. 6 to obtain a measure for the apparent cooperativity number (ωout). For nucleation-driven reactions (ωin = 1), the fit yields a value close to 1. For extension-driven reactions where the cooperativity number is >1, however, the obtained value ωout deviates significantly from the input value ωin.
FIGURE 4
FIGURE 4
Influence of the Hill coefficient on the kinetic interaction between protein and DNA. (A) Concentration dependence of the binding rates. If the protein interacts as a monomer with the DNA substrate, the curve follows a Michaelis-Menten dependence (black). However, for larger complexes (Hill coefficient nH ≥ 2), the profiles become sigmoidal (red and green for, respectively, a dimer and pentamer). (B) The ratio between extension and nucleation is concentration-dependent when the Hill coefficients differ for extension and nucleation. Blue and magenta denote the ratio between pentameric-monomeric and monomeric-pentameric binding units, respectively. (C) At three different concentrations (in order of increasing concentrations denoted by 1, 2, and 3 in the inset of panel A), the lattice occupancy profiles for the three independent cases are depicted. The black curves for nH = 2 (middle panel) in both nucleation and extension are the same for various protein concentrations. The magenta and blue curves, for next: nnucl = 1:5 and 5:1, respectively, are protein-concentration dependent. It is clear that the lattice occupancy profiles change when the ratio is not constant in the applied concentration regime.
FIGURE 5
FIGURE 5
Protein dissociation. After proteins have formed a single continuous filament on the DNA substrate, a linear decrease is observed when the protein disassembles from one end with kdis = 0.2 (MC step)−1 (black line). When all bound proteins have the same probability to dissociate irrespective of their position in the protein complex, an exponentially shaped disassembly curved is obtained with kdis = 6.7 × 10⁻⁴ (MC step)−1 (red line). If the proteins form multiple short protein patches on the DNA substrate with bare DNA in between, end-dependent disassembly shows again an exponentially shaped disassembly profile with kdis = 2.2 × 10⁻³ (MC step)−1 (green line).
FIGURE 6
FIGURE 6
Linear motion of a protein. (A) The position of a protein bound to the DNA substrate is followed while allowing unidirectional motion with kuni = 0.01 (MC step)−1. This yields an approximately linear decrease in time. (B) For a diffusive process with kdif = 0.01 (MC step)−1, the position of the protein along the DNA substrate displays a random walk. (C) As expected for a diffusive process, the mean-square displacement of a protein increases approximately linearly in time. The obtained diffusion constant is 0.0049 nt2 (MC step)−1 in excellent agreement with the expected rate of diffusion, formula image nt2 (MC step)−1.
FIGURE 7
FIGURE 7
Kymographs for various combinations of protein-DNA interactions. (A) Cooperative protein binding is visualized in time, where open representation corresponds to proteins occupying lattice sites and solid representation denotes unoccupied lattice positions. The simulation is carried out for n = 3, knucl =3× 10⁻⁵ site−1 (MC step)−1, and kext = 5 × 10⁻⁴ (MC step)−1. In the final saturated state, gaps remain smaller than the binding size of the protein. (B) In the presence of end-dependent disassembly, kdis = 7 × 10⁻⁴ (cluster end)−1 (MC step)−1, protein patches appear and disappear on the lattice. (C) Cooperative binding and diffusive motion of detached end-bound monomers, kdet = 0.01 (MC step)−1, and kstep = 0.1 (MC step)−1, yields a completely covered lattice. (D) In the presence of dissociation of detached monomers, kdis = 7 × 10⁻⁴ (detached monomer)−1 (MC step)−1, a combination of cooperative binding, dissociation, and diffusive motion of detached end-bound monomers also yields a completely covered lattice albeit on a longer timescale. (E) Cooperative binding and diffusive motion of protein patches, kdif = 0.01 (MC step)−1, yields a single continuous protein complex. (F) A combination of cooperative binding, dissociation, and diffusive motion leads to the formation of single continuous protein complex albeit on a longer timescale. (G) A similar saturated end state is observed for cooperative binding and unidirectional motion of protein patches, kuni = 0.01 (MC step)−1. (H) Same as panel F, but with unidirectional instead of diffusive motion. This also eventually leads to the formation of a single continuous protein complex.
FIGURE 8
FIGURE 8
Different biological systems to which the current Monte Carlo simulations can be applied. (A) The interaction between the RecA-like recombinase RAD51 and DNA was successfully modeled using the analysis described. This showed that RAD51 binds cooperatively to DNA forming short nucleoprotein filaments (12). (B) RNA polymerase transforms a single-stranded template into a double-stranded substrate in the presence of free nucleotides. Two different pathways exist. In the most common pathway, the polymerase creates full-length templates, whereas in the other case, known as abortive initiation, the polymerase forms short oligomers. The pathways are similar to, respectively, a high- and low-cooperative binding mode. (C) Structural maintenance of chromosomes (SMC) proteins form condensed DNA structures by binding cooperatively to DNA holding two DNA molecules in close proximity.

Similar articles

Cited by

References

    1. Seidel, R., J. van Noort, C. van der Scheer, J. G. P. Bloom, N. H. Dekker, C. F. Dutta, A. Blundell, T. Robinson, K. Firman, and C. Dekker. 2004. Real-time observation of DNA translocation by the type I restriction modification enzyme EcoR124I. Nat. Struct. Mol. Biol. 11:838–843. - PubMed
    1. McGhee, J. D., and P. H. von Hippel. 1974. Theoretical aspects of DNA-protein interactions—cooperative and non-cooperative binding of large ligands to a one-dimensional homogeneous lattice. J. Mol. Biol. 86:469–489. - PubMed
    1. Lonberg, N., S. C. Kowalczykowski, L. S. Paul, and P. H. von Hippel. 1981. Interactions of bacteriophage T4-coded gene 32 protein with nucleic acids: III. Binding-properties of 2 specific proteolytic digestion products of the protein (G32P*I and G32P*III). J. Mol. Biol. 145:123–138. - PubMed
    1. Ando, R. A., and S. W. Morrical. 1998. Single-stranded DNA binding properties of the UvsX recombinase of bacteriophage T4: binding parameters and effects of nucleotides. J. Mol. Biol. 283:785–796. - PubMed
    1. Moreno-Herrero, F., L. Holtzer, D. A. Koster, S. Shuman, C. Dekker, and N. H. Dekker. 2005. Atomic force microscopy shows that Vaccinia topoisomerase IB generates filaments on DNA in a cooperative fashion. Nucleic Acids Res. 33:5945–5953. - PMC - PubMed

Publication types