. 2008 Jul 23;28(30):7648-58.
doi: 10.1523/JNEUROSCI.0744-08.2008.

Lysosomes are the major vesicular compartment undergoing Ca2+-regulated exocytosis from cortical astrocytes

Affiliations

Lysosomes are the major vesicular compartment undergoing Ca2+-regulated exocytosis from cortical astrocytes

Dongdong Li et al. J Neurosci. .

Abstract

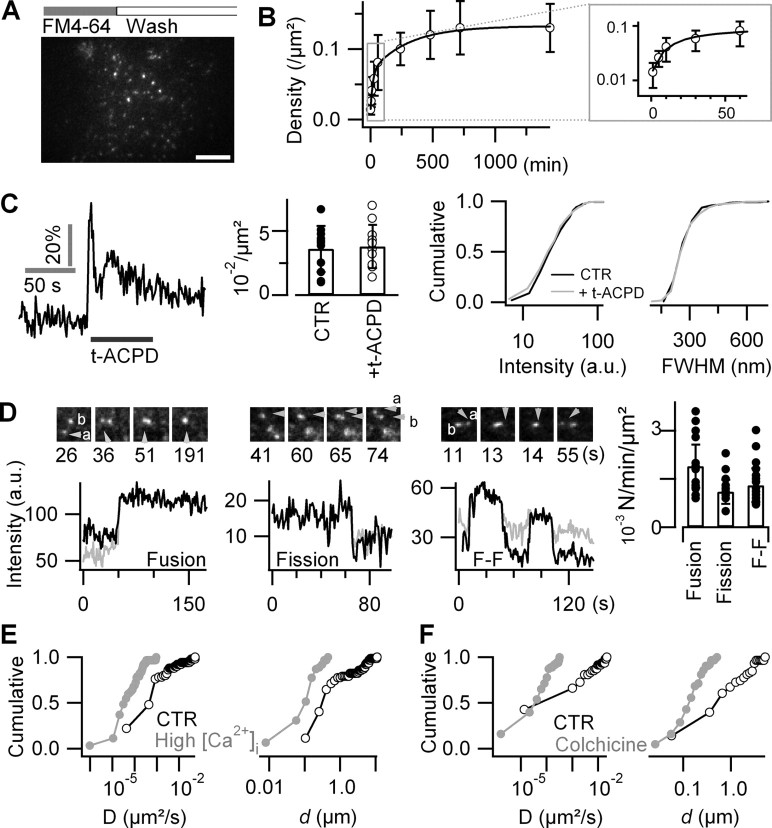
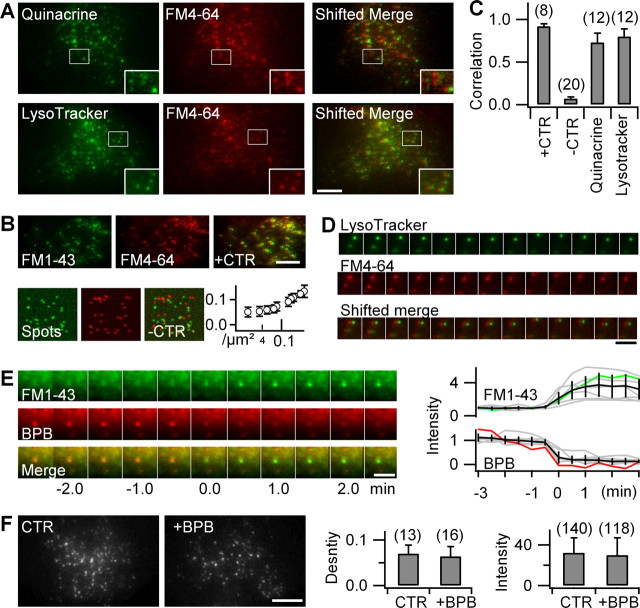
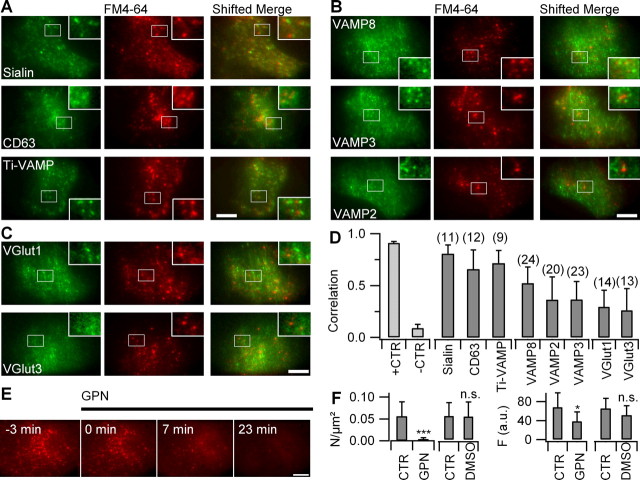
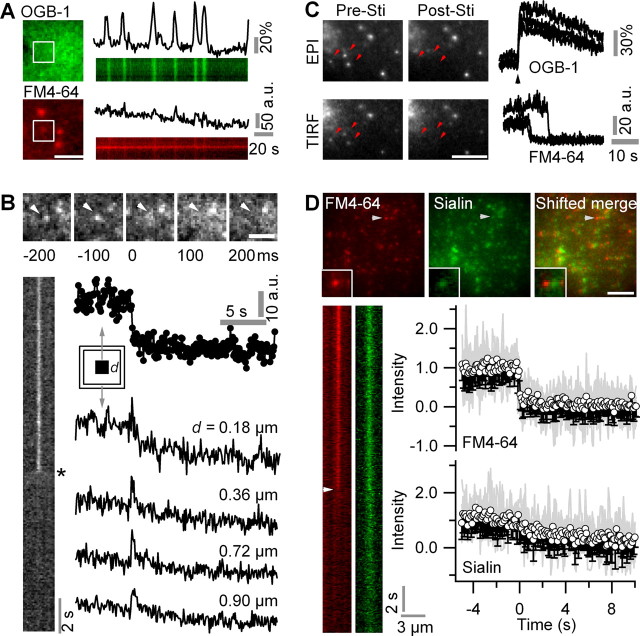
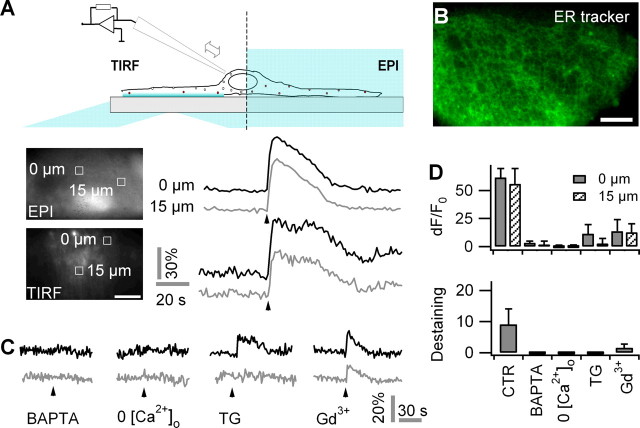
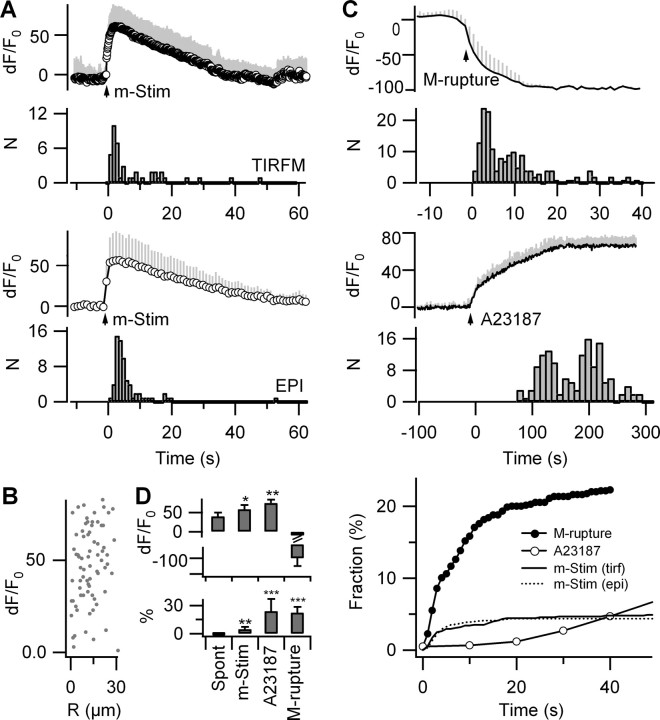
Although Ca(2+)-dependent exocytosis is considered to be a pathway for gliotransmitter release from astrocytes, the structural and functional bases of this process remain controversial. We studied the relationship between near-membrane Ca(2+) elevations and the dynamics of single astroglial vesicles with styryl (FM) dyes. We show that cultured astrocytes, unlike neurons, spontaneously internalize FM dyes, resulting in the labeling of the entire acidic vesicle population within minutes. Interestingly, metabotropic glutamate receptor activation did not affect the FM labeling. Most FM-stained vesicles expressed sialin, CD63/LAMP3, and VAMP7, three markers for lysosomes and late endosomes. A subset of lysosomes underwent asynchronous exocytosis that required both Ca(2+) mobilization from intracellular stores and Ca(2+) influx across the plasma membrane. Lysosomal fusion occurred within seconds and was complete with no evidence for kiss and run. Our experiments suggest that astroglial Ca(2+)-regulated exocytosis is carried by lysosomes and operates on a timescale orders of magnitude slower than synaptic transmission.


Figures

Figure 1.
Figure 1.
Astroglial FM labeling is activity independent. A, A 488 nm evanescent-wave excited fluorescence image of an astrocyte labeled by 15 min incubation in 6.7 μm FM4-64, followed by 20 min wash. Scale bar, 10 μm. B, Time-dependent uptake of FM4-64. Varying incubation times from 1 min to 24 h (n = 7–12 cells for each condition) revealed a biexponential increase in spot density. The inset displays zoom on 1–60 min time window. Error bars indicate SD of the mean. C, mGluR activation by perfusing during 5 min 100 μm t-APCD evoked a [Ca2+]i increase but did not affect the density, intensity, or size of FM-labeled puncta (n = 7 cells). Error bars indicate SD of the mean. D, Successive fusion and fission events of FM4-64-labeled puncta. Left, As a newcomer vesicle (a) fused with a resident vesicle (b), the fluorescence intensity of the resultant spot increased to the sum of both donor compartments (supplemental Movie S3, available at www.jneurosci.org as supplemental material). Middle, Fission split the initial fluorescence of the donor vesicle (arrowhead) into two dimmer daughter compartments (a and b), which then moved independently (supplemental Movie S4, available at www.jneurosci.org as supplemental material). Right, Fusion–fission (F–F) event of two vesicles (a and b) merging and a third vesicle departing (supplemental Movie S5, available at www.jneurosci.org as supplemental material). Traces were corrected for local background. The gray and black traces are from vesicles a and b, respectively. Scale bar, 2 μm. Frequency of different types of dynamic interactions among labeled vesicles (n = 14 cells per condition; median ± absolute deviation). E, F, Cumulative histograms of mobility parameters of tracked single FM-labeled spots. Increasing intracellular [Ca2+]i by controlled mechanical stimulation (E, gray) or disruption of microtubules with colchicine (F, gray) (100 μm; 4 h) decreased the average short-range diffusion coefficient, D (left panels), and reduced the displacement, d (right panels), compared with controls (black traces).
Figure 2.
Figure 2.
FM dyes label all acidic astroglial compartments. A, Dual-color TIRF images of FM4-64-stained astrocytes colabeled with the acidic-compartment markers quinacrine (top) or Lysotracker Green (bottom). The boxed areas are shown at higher magnification (insets). To better visualize colocalization, the red-channel image is left-shifted by 5 pixels relative to the green channel (shifted merge). Scale bar, 10 μm. B, Quantifying colocalization. Top, Coloading of FM1-43 and FM4-64 (6.7 μm; 15 min, followed by 20 min wash for both dyes) was used as a positive control (+CTR; 12 = 0.92 ± 0.03). Bottom, Computer-generated image pairs containing randomly placed fluorescent spots at the same density as FM-labeled organelles were used as negative controls (−CTR). Spots were blurred with the experimental point-spread function and noise added to mimic the signal-to-noise ratio of typical FM4-64 images. Evolution of false apparent colocalization with particle density. In our imaging conditions (∼0.01–0.1 spots/μm2), 12 = 0.07 ± 0.02 (−CTR; n = 20 trials) defines the lower bound of useful colocalization estimates. C, Values of 12 were significantly different for quinacrine and Lysotracker versus both −CTR and +CTR (Table 1). Numbers are cells examined. Error bars indicate SD of the mean. Scale bar, 10 μm. D, Object-based colocalization. Dual-color epifluorescence tracking (1 Hz) of Lysotracker and FM4-64 shows the comovement of both labels (shifted merge). Scale bar, 3 μm. E, BPB reports vesicle acidification. Interlaced dual-excitation dual-emission epifluorescence images of a tracked and recentered single FM1-43/BPB double-labeled vesicle. The traces (right panel) illustrate the concomitant and antiphasic fluorescence changes of FM1-43 (green) and BPB (red) fluorescence for the organelle shown left, as well as for other organelles (gray) that were temporally aligned to the midpoint of the red-to-green transition (t = 0 s) and normalized to the pretransition fluorescence, indicating the lifting of FM quenching with time after internalization. The population average is in black. Scale bar, 2 μm. F, The 488/560 nm (ex/em) TIRF images of an astrocyte labeled by FM1-43 in the absence (CTR) and presence of BPB. BPB uptake did not modify the density (p = 0.5, t test) nor the intensity (p = 0.63, KS test) of FM1-43-labeled vesicles. Shown are numbers of cells (density) and vesicles (intensity). Scale bar, 10 μm.
Figure 3.
Figure 3.
FM-labeled vesicles are late endosomes/lysosomes. A, TIRF images of astrocytes expressing EGFP-sialin (top), CD63/LAMP3 (middle), and Ti-VAMP (bottom), labeled with FM4-64. The insets show boxed regions at higher magnification. Color-merged images (shifted merge) as in Figure 2 are shown. B, Expression of EGFP-VAMP8 (top), EGFP-VAMP3 (middle), and VAMP2 (bottom). C, Venus-VGlut1 and -3 labeling. D, Modified Pearson's correlation coefficient 12 between FM4-64 and various organelle markers (see supplemental material, available at www.jneurosci.org). Number of cells analyzed indicated above bars. Error bars indicate SD of the mean. E, Time-lapse epifluorescence images of a FM4-64-labeled astrocyte before (−3 min) and after selective lysosomal lysis with GPN (200 μm). F, Density of FM-labeled puncta (left) and whole-cell fluorescence intensity (right) for control and GPN-treated astrocytes, imaged 30–60 min after application of 200 μm GPN (n = 7–15). The same dilution (1:500) of DMSO had no effect on the stability of FM-loaded organelles (n = 4 cells). Scale bars, 10 μm. *p < 0.05; ***p < 0.001.
Figure 4.
Figure 4.
Astroglial lysosomes undergo Ca2+-dependent complete exocytosis. A, Spontaneous Ca2+ oscillations did not trigger exocytosis of FM4-64-labeled puncta (n = 92 Ca2+ transients in 12 cells). Scale bar, 3 μm. B, Typical signature of a fusion event in response to m-Stim on sequential TIRF images of a 488 nm excited 10 Hz ministack and kymograph. The central FM4-64-loaded vesicle (arrowhead) fuses at a time 0. Note the rapid destaining and spread of FM4-64 fluorescence (asterisk). Right, Fluorescence changes with time, measured in a small subregion centered on the same vesicle (3 × 3 pixels; circles) and in several concentric regions (0.2 μm wide) with increasing distance d. Scale bar, 2 μm. C, Left, Epifluorescence (EPI) and TIRF images of the same region of an FM4-64-labeled astrocyte before (Pre-Sti) and after (Post-Sti) stimulation. Epifluorescence FM4-64 and TIRF OGB-1 fluorescence from 1 × 1 μm single-spot regions in response to m-Stim (black arrowhead). Systematic and simultaneous Ca2+-dependent loss of the vesicle from EPI and TIRF images (supplemental Movie S6, available at www.jneurosci.org as supplemental material) indicates dye release in the extracellular space and not movement from the evanescent field into deeper cytoplasmic regions. Scale bar, 5 μm. D, Top, Dual-color 488-nm TIRF images of a EGFP-sialin/FM4-64 double-labeled astrocyte. Inset, Zoom near arrowhead. Bottom, Kymographs of the same vesicle (10 Hz) undergoing exocytosis in response to m-Stim (supplemental Movie S7, available at www.jneurosci.org as supplemental material). The white arrowhead identifies FM4-64 release at t = 0 s. The initiation of exocytosis was defined as the first point of FM4-64 fluorescence falling below the 2 s prestimulus average minus three times its SD. Evolution with time of FM4-64 (top) and EGFP (bottom) fluorescence of n = 13 double-labeled organelles undergoing Ca2+ triggered exocytosis after m-Stim. The gray traces are superimposed individual normalized and temporally aligned events. The traces were corrected for local background. Scale bar, 10 μm.
Figure 5.
Figure 5.
Mechanically evoked astroglial exocytosis requires both extracellular and intracellular store-operated Ca2+. A, Top, Scheme of combined TIRF and epifluorescence (EPI) imaging of near-membrane and bulk [Ca2+]i in response to m-Stim. Bottom, Typical EPI and TIRF images of OGB-1-labeled astrocyte, and temporal profiles of the Ca2+ response (dF/F0) to m-Stim (arrowhead) at the stimulation site (black) and 15 μm apart (gray); ROIs are identified on the images nearby. B, Subcellular distribution of ER tracker (EPI). Scale bars, 10 μm. C, Representative traces of evoked Ca2+ responses to m-Stim from BAPTA, AM-treated astrocytes (60 μm, 40 min; left), Ca2+-free extracellular solution (middle left), thapsigargin (TG) (500 nm, 30 min; middle), and Gd3+ (100 μm; middle right). D, Average dF/F0 peak amplitudes of Ca2+ responses at the site of m-Stim (solid bars) and 15 μm apart (hatched) as well as numbers fusion events per cell in the same conditions. Error bars indicate SD of the mean.
Figure 6.
Figure 6.
Ca2+-triggered asynchronous exocytosis of a subset of lysosomes. A, Ca2+ traces and temporal distribution of FM destaining pooled from n = 8 OGB-1/FM4-64 double-labeled astrocytes, imaged with 10 Hz 488 nm TIRF (top) and 1 Hz 488 nm epifluorescence excitation (bottom). Traces were aligned to the first Ca2+ data point reaching 63% of the peak dF/F0 value and normalized by the 5 s (TIRF) or 20 s (EPI) prestimulus fluorescence and finally averaged. The time course of FM destaining measured in TIRF (top; 42 events) and epifluorescence (bottom; 72 events; p = 0.6, KS test) did not significantly differ and occurred several seconds after the peak [Ca2+]i. B, Parametric plot of dF/F0 Ca2+ versus distance R from the site of m-Stim shows no correlation (n = 72 fusion events). C, Top, Instantaneous [Ca2+]i increases after membrane rupture detected as the loss of OGB-1 fluorescence resulted in the rapid release of the entire RRP. Middle, Application of the Ca2+ ionophore A-23187 (50 μm) in the presence of 2 mm extracellular Ca2+ gradually increased Ca2+ to a maximum of dF/F0 = 75 ± 10%. Exocytosis required 0.5 dF/F0 Ca2+ to start (n = 4 cells; inset) and reached an amplitude four times larger than that observed with m-Stim (9.1 ± 5.0 vs 39.0 ± 23.5 fusion events/cell). Bottom, Comparison of the release kinetics for m-Stim, ionophore, and membrane rupture. D, Peak [Ca2+]i dF/F0 and percentage of FM-labeled vesicles released under various conditions (n = 6–9 cells each). Differences versus spontaneously occurring [Ca2+]i transients. Error bars indicate SD of the mean. *p < 0.05; **p < 0.01; ***p < 0.001.

Similar articles

Cited by

References

    1. Advani RJ, Yang B, Prekeris R, Lee KC, Klumperman J, Scheller RH. VAMP-7 mediates vesicular transport from endosomes to lysosomes. J Cell Biol. 1999;146:765–776. - PMC - PubMed
    1. Andrei C, Margiocco P, Poggi A, Lotti LV, Torrisi MR, Rubartelli A. Phospholipases C and A2 control lysosome-mediated IL-1 beta secretion: implications for inflammatory processes. Proc Natl Acad Sci U S A. 2004;101:9745–9750. - PMC - PubMed
    1. Andrews NW. Regulated secretion of conventional lysosomes. Trends Cell Biol. 2000;10:316–321. - PubMed
    1. Araque A, Sanzgiri RP, Parpura V, Haydon PG. Calcium elevation in astrocytes causes an NMDA receptor-dependent increase in the frequency of miniature synaptic currents in cultured hippocampal neurons. J Neurosci. 1998;18:6822–6829. - PMC - PubMed
    1. Bergles DE, Diamond JS, Jahr CE. Clearance of gluatamate inside the synapse and beyond. Curr Opin Neurobiol. 1999;9:293–298. - PubMed

Publication types

MeSH terms