. 2009 Aug;13(8B):2744-2753.
doi: 10.1111/j.1582-4934.2008.00404.x.

Down-regulation of cardiac lineage protein (CLP-1) expression in CLP-1 +/- mice affords

Affiliations

Down-regulation of cardiac lineage protein (CLP-1) expression in CLP-1 +/- mice affords

Eduardo Mascareno et al. J Cell Mol Med. 2009 Aug.

Abstract

In order to understand the transcriptional mechanism that underlies cell protection to stress, we evaluated the role of CLP-1, a known inhibitor of the transcription elongation complex (pTEFb), in CLP-1 +/- mice hearts. Using the isolated heart model, we observed that the CLP-1 +/- hearts, when subjected to ischaemic stress and evaluated by haemodynamic measurements, exhibit significant cardioprotection. CLP-1 remains associated with the pTEFb complex in the heterozygous hearts, where as it is released in the wild-type hearts suggesting the involvement of pTEFb regulation in cell protection. There was a decrease in Cdk7 and Cdk9 kinase activity and consequently in phosphorylation of serine-5 and serine-2 of Pol II CTD in CLP-1 +/- hearts. However, the levels of mitochondrial proteins, PGC-1alpha and HIF-1alpha, which enhance mitochondrial activity and are implicated in cell survival, were increased in CLP-1 +/- hearts subjected to ischaemic stress compared to that in wild-type CLP-1 +/- hearts treated identically. There was also an increase in the expression of pyruvate dehydrogenase kinase (PDK-1), which facilitates cell adaptation to hypoxic stress. Taken together, our data suggest that regulation of the CLP-1 levels is critical to cellular adaptation of the survival program that protects cardiomyocytes against stress due collectively to a decrease in RNA Pol II phosphorylation but an increase in expression of target proteins that regulate mitochondrial function and metabolic adaptation to stress.


Figures

Figure 1
Figure 1
(A) Schematic representation of the experimental protocol used for the evaluation of haemodynamic parameters and infarct size. (B) A diagram of the experimental protocols for stress application and analysis of wild‐type and CLP‐1 +/− hearts (see Figs. 4 and 5).
Figure 2
Figure 2
CLP‐1 +/− mice hearts subjected to ischemia/reperfusion show a cardioprotective phenotype. (A) aortic flow, (B) coronary flow, (C) Heart rate, (D) Developed pressure and (E) first derivative of developed pressure, respectively reveal that the haemodynamic parameters in CLP‐1 +/− mice hearts are similar to those of preconditioned wild‐type heart during ischemia/reperfusion. Ischemia, reperfusion and preconditioning were done as described in ‘Materials and Methods’. Results are shown as mean ± S.E.M. of six mice per group. *P < 0.05 versus control, **P < 0.01 versus control.
Figure 2
Figure 2
CLP‐1 +/− mice hearts subjected to ischemia/reperfusion show a cardioprotective phenotype. (A) aortic flow, (B) coronary flow, (C) Heart rate, (D) Developed pressure and (E) first derivative of developed pressure, respectively reveal that the haemodynamic parameters in CLP‐1 +/− mice hearts are similar to those of preconditioned wild‐type heart during ischemia/reperfusion. Ischemia, reperfusion and preconditioning were done as described in ‘Materials and Methods’. Results are shown as mean ± S.E.M. of six mice per group. *P < 0.05 versus control, **P < 0.01 versus control.
Figure 3
Figure 3
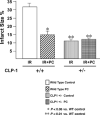
CLP‐1 +/− mice hearts exhibit a decreased infarct size. Infarct size was measured as described in Materials and Methods. Infarct size is significantly reduced in CLP‐1 +/− heart mice during ischemia/reperfusion without preconditioning. Results are shown as mean ± S.E.M. of six mice per group. *P < 0.05 versus control, **P < 0.01 versus control.
Figure 4
Figure 4
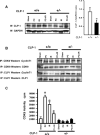
Changes in CLP‐1 expression level modulates the pTEFb complex activity. (A) Western blot shows the level of CLP‐1 protein expression in CLP‐1 +/+ and CLP‐1 +/− hearts during each stress. The bar graph indicates the ratio between CLP‐1 and GAPDH expression, and shows a decrease in expression level of CLP‐1 protein in CLP‐1 +/− hearts. This measurement was performed in quadruplicate and the results are shown as mean ± S.E.M. per group. *P < 0.05 versus CLP‐1+/+. (B) Association of CLP‐1 with cyclin T was determined by immunoprecipitation of extracts with antibodies against Cdk9 or CLP‐1 followed by Western blotting with cyclin T1 antibody. (C) Cdk activity was measured as described in Materials and Methods. The Cdk9 activity measurement was performed in triplicate and the results are shown as mean ± SEM per group. *P < 0.05 versus control. (D) Extracts as above were used for Western blotting using antibodies for phosphoserine 2 and 5 and Pol II. Graph bars show the relative increase or decrease in phosphoserine 5 and 2 versus total Pol II expression. At least three experiments were performed and a representative figure is shown. *P < 0.05 versus control CLP‐1+/+, **P < 0.05 versus control CLP‐1 +/−, #P < 0.01 versus control CLP‐1+/+.
Figure 4
Figure 4
Changes in CLP‐1 expression level modulates the pTEFb complex activity. (A) Western blot shows the level of CLP‐1 protein expression in CLP‐1 +/+ and CLP‐1 +/− hearts during each stress. The bar graph indicates the ratio between CLP‐1 and GAPDH expression, and shows a decrease in expression level of CLP‐1 protein in CLP‐1 +/− hearts. This measurement was performed in quadruplicate and the results are shown as mean ± S.E.M. per group. *P < 0.05 versus CLP‐1+/+. (B) Association of CLP‐1 with cyclin T was determined by immunoprecipitation of extracts with antibodies against Cdk9 or CLP‐1 followed by Western blotting with cyclin T1 antibody. (C) Cdk activity was measured as described in Materials and Methods. The Cdk9 activity measurement was performed in triplicate and the results are shown as mean ± SEM per group. *P < 0.05 versus control. (D) Extracts as above were used for Western blotting using antibodies for phosphoserine 2 and 5 and Pol II. Graph bars show the relative increase or decrease in phosphoserine 5 and 2 versus total Pol II expression. At least three experiments were performed and a representative figure is shown. *P < 0.05 versus control CLP‐1+/+, **P < 0.05 versus control CLP‐1 +/−, #P < 0.01 versus control CLP‐1+/+.
Figure 5
Figure 5
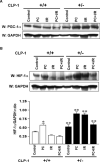
Expression of PGC‐1α and HIF‐1α in heart‐tissue of CLP‐1 heterozygous mice. (A) The expression levels of PGC‐1α in the protein heart extracts from control, preconditioning (PC), ischemia/reperfusion (I/R) and I/R with PC groups of wild‐type and in CLP‐1 +/− hearts was determined by Western blot analysis. GAPDH was used as loading control. (B) We use the same extracts as in Figure 4A to determine the expression levels of HIF‐1α, and as before GAPDH was used as loading control. The experiment was repeated three times and a representative experiment is shown. *P < 0.05 versus wild‐type control, **P < 0.01 versus wild‐type control. (C) The ubiquitination profile of HIF‐1 was examined by using heart extracts from each group. The extracts were used for immunoprecipitation with anti‐ubiquitin antibody followed by Western blot with an antibody against HIF‐1α. (D) The interaction between HIF‐1α and SUMO‐1 was determined by immunoprecipitations using anti− HIF‐1α antibody followed by Western blotting with anti‐SUMO‐1 antibody. Western blot with anti− HIF‐1α antibody served as loading control. (E) Western blot was performed as in (A) to evaluate expression of SUMO‐1. GAPDH was used as loading control. (F) Expression of pyruvate dehydrogenase kinase‐1 (PDK‐1) was evaluated by Western blot using antibody against PDK‐1. The representative figure shows increase in PDK‐1 expression in extracts from CLP‐1 +/− mice hearts subjected to stress. GAPDH expression was used as loading control.
Figure 5
Figure 5
Expression of PGC‐1α and HIF‐1α in heart‐tissue of CLP‐1 heterozygous mice. (A) The expression levels of PGC‐1α in the protein heart extracts from control, preconditioning (PC), ischemia/reperfusion (I/R) and I/R with PC groups of wild‐type and in CLP‐1 +/− hearts was determined by Western blot analysis. GAPDH was used as loading control. (B) We use the same extracts as in Figure 4A to determine the expression levels of HIF‐1α, and as before GAPDH was used as loading control. The experiment was repeated three times and a representative experiment is shown. *P < 0.05 versus wild‐type control, **P < 0.01 versus wild‐type control. (C) The ubiquitination profile of HIF‐1 was examined by using heart extracts from each group. The extracts were used for immunoprecipitation with anti‐ubiquitin antibody followed by Western blot with an antibody against HIF‐1α. (D) The interaction between HIF‐1α and SUMO‐1 was determined by immunoprecipitations using anti− HIF‐1α antibody followed by Western blotting with anti‐SUMO‐1 antibody. Western blot with anti− HIF‐1α antibody served as loading control. (E) Western blot was performed as in (A) to evaluate expression of SUMO‐1. GAPDH was used as loading control. (F) Expression of pyruvate dehydrogenase kinase‐1 (PDK‐1) was evaluated by Western blot using antibody against PDK‐1. The representative figure shows increase in PDK‐1 expression in extracts from CLP‐1 +/− mice hearts subjected to stress. GAPDH expression was used as loading control.

Similar articles

Cited by

References

    1. Ago T, Sadoshima J. Thioredoxin and ventricular remodeling. J Mol Cell Cardiol. 2006; 41: 762–73. - PMC - PubMed
    1. Ananthakrishnan R, Hallam K, Li Q, et al . JAK‐STAT pathway in cardiac ischaemic stress. Vascul Pharmacol. 2005; 43: 353–6. - PubMed
    1. Willis MS, Patterson C. Into the heart: the emerging role of the ubiquitin‐ proteasome system. J Mol Cell Cardiol. 2006; 41: 567–9. - PubMed
    1. Hall G, Hasday JD, Rogers TB. Regulating the regulator: NF‐kappaB signaling in heart. J Mol Cell Cardiol. 2006; 41: 580–91. - PubMed
    1. Das DK, Maulik N. Conversion of death signal into survival signal by redox signaling. Biochemistry. 2004; 69: 10–7. - PubMed

Publication types