. 2008 Jun 27;133(7):1149-61.
doi: 10.1016/j.cell.2008.05.048.

A polymorphism in CALHM1 influences Ca2+ homeostasis, Abeta levels, and Alzheimer's disease risk

Affiliations

A polymorphism in CALHM1 influences Ca2+ homeostasis, Abeta levels, and Alzheimer's disease risk

Ute Dreses-Werringloer et al. Cell. .

Abstract

Alzheimer's disease (AD) is a genetically heterogeneous disorder characterized by early hippocampal atrophy and cerebral amyloid-beta (Abeta) peptide deposition. Using TissueInfo to screen for genes preferentially expressed in the hippocampus and located in AD linkage regions, we identified a gene on 10q24.33 that we call CALHM1. We show that CALHM1 encodes a multipass transmembrane glycoprotein that controls cytosolic Ca(2+) concentrations and Abeta levels. CALHM1 homomultimerizes, shares strong sequence similarities with the selectivity filter of the NMDA receptor, and generates a large Ca(2+) conductance across the plasma membrane. Importantly, we determined that the CALHM1 P86L polymorphism (rs2986017) is significantly associated with AD in independent case-control studies of 3404 participants (allele-specific OR = 1.44, p = 2 x 10(-10)). We further found that the P86L polymorphism increases Abeta levels by interfering with CALHM1-mediated Ca(2+) permeability. We propose that CALHM1 encodes an essential component of a previously uncharacterized cerebral Ca(2+) channel that controls Abeta levels and susceptibility to late-onset AD.


Figures
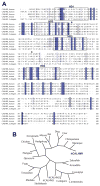
Figure 1
Figure 1. Alignment and phylogeny of CALHM1
(A) Sequence alignment of human CALHM3, CALHM2, and CALHM1, and of murine and C. elegans CALHM1. Conserved sequences are highlighted in blue and sequence conservation is mapped in a color gradient, the darkest color representing sequences with absolute identity and lighter colors representing sequences with weaker conservation. Boxes denote hydrophobic domains 1–4 (HD1–4). Stars, predicted N-glycosylation sites on human CALHM1. (B) Phylogenetic tree including human CALHM1 (hCALHM1).
Figure 2
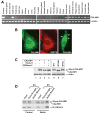
Figure 2. Tissue expression, subcellular localization, and N-glycosylation of human CALHM1
(A) Total RNA was used for RT-PCR analyses targeting CALHM1 and β-actin transcripts in multiple human tissues and brain regions. (B) Immunofluorescence staining in CHO cells transfected with human Myc-tagged CALHM1 using anti-Myc (green) and anti-GRP78 (red) antibodies. (C) Lysates from HT-22 cells transfected with wild type (WT) or mutated (N140A and N74A) Myc-CALHM1, were incubated in the absence (−) or presence (+) of endoglycosidase H (Endo H) or N-glycosidase F (PNGase F). Cell lysates were probed with anti-Myc (upper panels) and anti-actin (lower panels) antibodies. (D) Cell surface-biotinylated proteins from Myc-CALHM1-transfected HT-22 cells were precipitated using immobilized avidin and probed with anti-Myc (upper panel) and anti-N-cadherin (lower panel, cell surface positive control) antibodies.
Figure 3
Figure 3. CALHM1 controls Ca2+ influx by a mechanism that does not promote VGCC or SOCE channel activation
(A) Cytoplasmic Ca2+ measurements using Fluo-4 loading and Ca2+ add-back assays in HT-22 cells transiently transfected with Myc-CALHM1 or control vector. Cells were first incubated in Ca2+-free buffer (0 CaCl2) and then challenged with physiological extracellular Ca2+ concentrations (1.4 mM CaCl2) to monitor the progressive restoration of basal [Ca2+]i. Traces illustrate the mean relative fluorescence units (RFU) +/− S.D. (shaded areas) of three independent experiments. Inset, WB of the corresponding cell lysates probed with anti-Myc antibody (Vec, vector; C, CALHM1). (B) Peak and steady-state of [Ca2+]i measurements as in (A) expressed in ΔF/F0 (*, P<0.001; Student’s t test). (C–H) Cytoplasmic Ca2+ measurements as in (A) in cells pretreated with 2-APB [50 μM, (C)], SNX-482 [0.5 μM, (D)], mibefradil [1 μM, (D)], nifedipine [10 μM, (E)], ω-conotoxin MVIIC [Conotoxin, 5 μM, (E)], dantrolene [DTL, 10 μM, (F)], xestospongin C [XeC, 2 μM, (F)], or with the indicated concentrations of CoCl2 (G) and NiCl2 (H). Traces in (C–H) illustrate representative measurements of 2–3 independent experiments. (I) WB with anti-Myc (upper panels) and anti-actin (lower panels) antibodies of protein extracts obtained from cells treated as in (G) and (H).
Figure 4
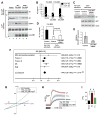
Figure 4. Ion channel properties of CALHM1
(A) Lysates from non-transfected (NT) and Myc-CALHM1-tranfected HEK293 cells were analyzed by WB in the absence (Control) or presence of β-mercaptoethanol (+βME) using anti-Myc (two upper panels) and anti-actin (lower panel) antibodies. (B) Lysates from HEK293 cells transfected (+) or not (−) with V5-tagged CALHM1 (V5-CALHM1) or Myc-CALHM1, were immunoprecipitated with anti-Myc antibody. Total lysates (Input, left panels) and immunoprecipitates (Anti-Myc IP, right panels) were analyzed by WB using antibodies against V5 (upper panels), Myc (middle panels), and actin (lower panels). (C) Partial sequence alignment of human NMDAR NR2 (NMDAR2) subunits A–D and CALHM1 from various species. Sequence conservation is highlighted in a blue gradient as described in Fig. 1A. Star denotes Q/R/N site. (D) Cytoplasmic Ca2+ measurements in HT-22 cells transiently transfected with control vector and WT or N72G-mutated Myc-CALHM1. Cells were treated and results analyzed as in Fig. 3A (n = 3 independent experiments). Inset, WB of the corresponding cell lysates with anti-Myc antibody. (E) Peak of [Ca2+]i measurements as in (D) expressed in ΔF/F0 (*, P<0.001; Student’s t test). (F) Representative current traces during voltage ramps in Xenopus oocytes injected with CALHM1 cRNA (blue and green traces) or water (red trace) in normal LCa96 solution (blue and red traces) or in Na+-free LCa96 solution (replaced with equimolar N-methyl-D-glucamine (NMDG); green trace). (G) Whole-cell currents in CALHM1-expressing (blue and red traces) or control (black trace) CHO cells in response to voltage ramps before (blue trace) and after (red trace) perfusion with 100 μM Gd3+. Bath contained 120 mM NaCl, pipette solution contained 122 mM CsCl (see Experimental Procedures). Cell capacitances of the CALHM1-expressing and control cells were 18.5 pF and 13.0 pF, respectively. (H) Whole-cell currents in CALHM1-expressing CHO cells (uncorrected for leakage currents) in response to voltage ramps in bi-ionic Ca2+/Cs+ solutions (20 mM Ca-aspartate in bath, 120 mM Cs-aspartate in pipette; see Experimental Procedures) before (blue trace) or after (red trace) bath addition of 100 μM Gd3+(Cm = 24.1 pF). Reversal potential Vrev = +8.3 ± 2.9 mV (n = 7) after correction for liquid junction potential and leakage current, indicating PCa : PCs = 5. No currents were observed in CALHM1-expressing cells with NMDG-aspartate in bath and pipette solutions (black trace; Cm = 20.5 pF).
Figure 5
Figure 5. The CALHM1 P86L polymorphism influences Ca2+ homeostasis, APP processing, and AD risk
(A and B) SwAPP695-N2a cells were transiently transfected with control vector or with WT or P86L-mutated Myc-CALHM1. Six and half hours post-transfection, medium was changed and cells were incubated for 60 min in the absence or presence of Ca2+ add-back conditions as described in Experimental Procedures. Total secreted Aβ and sAPPα, and cellular APP and Myc-CALHM1 were analyzed by WB (A). Secreted Aβ1-40 and Aβ1-42 were analyzed by ELISA in the presence of Ca2+ add-back conditions (n = 12; Student’s t test) (B). (C–E) APP695-SH-SY5Y cells differentiated for 15 days with retinoic acid were treated for 3 days with Accell siRNAs directed against human CALHM1. Medium was then changed and cells were incubated for 90 min in the absence or presence of Ca2+ add-back conditions. Total secreted Aβ and cellular APP and actin were analyzed by WB (C). Total secreted Aβ1-x was quantified by ELISA (n = 3; Student’s t test) (D). CALHM1 mRNA levels were assayed by real-time qRT-PCR analysis. Histogram illustrates the mean relative CALHM1 expression ± S.D. (control, n = 4; CALHM1 siRNA, n = 3) (E). (F) Five independent case-control studies were analyzed to assess the association of rs2986017 with AD risk. The allelic OR (T vs. C) was estimated in each population and in the combined one. 1Test for heterogeneity: χ2 = 2.84, df = 4, P = 0.59; Test for overall effect: Z = 6.06, P = 2.10−9 (Mantel-Haentzel method, fixed OR = 1.42 [1.27–1.59]). (G) Whole-cell currents in CHO cells expressing WT- (blue trace; Cm = 13.2 pF) or P86L-CALHM1 (green trace; Cm = 22.9 pF) in same bi-ionic conditions as in Fig. 4H. P86L-CALHM1-expressing cells remained sensitive to block by 100 μM Gd3+ (red trace), but the reversal potential was shifted to more hyperpolarized voltages (Vrev = −8.9 ± 3.6 mV ; n = 6), indicating a reduced Ca2+ permeability (PCa : PCs = 2) compared with that of WT-CALHM1. (H) Cytoplasmic Ca2+ measurements in HT-22 cells transiently transfected with control vector and WT or P86L-mutated Myc-CALHM1. Cells were treated and results analyzed as in Fig. 3A (n = 3 independent experiments). Inset, WB of the corresponding cell lysates with anti-Myc antibody. (I) Peak of [Ca2+]i measurements as in (H) expressed in Δ F/F0 (*, P<0.001; Student’s t test).

Comment in

  • No association between CALHM1 and Alzheimer's disease risk.
    Bertram L, Schjeide BM, Hooli B, Mullin K, Hiltunen M, Soininen H, Ingelsson M, Lannfelt L, Blacker D, Tanzi RE. Bertram L, et al. Cell. 2008 Dec 12;135(6):993-4; author reply 994-6. doi: 10.1016/j.cell.2008.11.030. Cell. 2008. PMID: 19070563 Free PMC article. No abstract available.

Similar articles

Cited by

References

    1. Berridge MJ, Bootman MD, Roderick HL. Calcium signalling: dynamics, homeostasis and remodelling. Nat Rev Mol Cell Biol. 2003;4:517–529. - PubMed
    1. Bertram L, Blacker D, Mullin K, Keeney D, Jones J, Basu S, Yhu S, McInnis MG, Go RC, Vekrellis K, et al. Evidence for genetic linkage of Alzheimer’s disease to chromosome 10q. Science. 2000;290:2302–2303. - PubMed
    1. Bertram L, Hsiao M, Lange C, Blacker D, Tanzi RE. Single-nucleotide polymorphism rs498055 on chromosome 10q24 is not associated with Alzheimer disease in two independent family samples. Am J Hum Genet. 2006;79:180–183. author reply 183–184. - PMC - PubMed
    1. Bertram L, McQueen MB, Mullin K, Blacker D, Tanzi RE. Systematic meta-analyses of Alzheimer disease genetic association studies: the AlzGene database. Nat Genet. 2007;39:17–23. - PubMed
    1. Blacker D, Bertram L, Saunders AJ, Moscarillo TJ, Albert MS, Wiener H, Perry RT, Collins JS, Harrell LE, Go RC, et al. Results of a high-resolution genome screen of 437 Alzheimer’s disease families. Hum Mol Genet. 2003;12:23–32. - PubMed

Publication types

MeSH terms