. 2008 Sep 1;112(5):1912-22.
doi: 10.1182/blood-2008-04-149815. Epub 2008 Jun 23.

Effective elimination of fludarabine-resistant CLL cells by PEITC through a redox-mediated mechanism

Affiliations

Effective elimination of fludarabine-resistant CLL cells by PEITC through a redox-mediated mechanism

Dunyaporn Trachootham et al. Blood. .

Abstract

Chronic lymphocytic leukemia (CLL) is the most common adult leukemia, and resistance to fludarabine-based therapies is a major challenge in CLL treatment. Because CLL cells are known to have elevated levels of reactive oxygen species (ROS), we aimed to test a novel ROS-mediated strategy to eliminate fludarabine-resistant CLL cells based on this redox alteration. Using primary CLL cells and normal lymphocytes from patients (n = 58) and healthy subjects (n = 12), we showed that both fludarabine-resistant and -sensitive CLL cells were highly sensitive to beta-phenylethyl isothiocyanate (PEITC) with mean IC(50) values of 5.4 microM and 5.1 microM, respectively. Normal lymphocytes were significantly less sensitive to PEITC (IC(50) = 27 microM, P < .001). CLL cells exhibited intrinsically higher ROS level and lower cellular glutathione, which were shown to be the critical determinants of CLL sensitivity to PEITC. Exposure of CLL cells to PEITC induced severe glutathione depletion, ROS accumulation, and oxidation of mitochondrial cardiolipin leading to massive cell death. Such ROS stress also caused deglutathionylation of MCL1, followed by a rapid degradation of this cell survival molecule. Our study demonstrated that the natural compound PEITC is effective in eliminating fludarabine-resistant CLL cells through a redox-mediated mechanism with low toxicity to normal lymphocytes, and warrants further clinical evaluation.


Figures
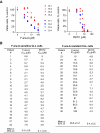
Figure 1
Figure 1
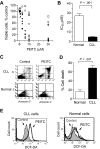
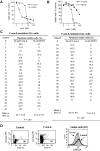
Cytotoxic effect of PEITC in fludarabine-sensitive and resistant CLL cells. (A) Cytotoxicity of PEITC and F-ara-A in primary CLL cells, after 72-hour incubation detected by MTT assay. Results of 8 representative patient samples (4 F-ara-A–sensitive CLL in blue, S-1 to S-4; 4 F-ara-A–resistant CLL in red, R-1 to R-4) are shown. Each data point represents the mean of triplicate determinations. (B) Comparison between the concentrations required to cause a loss in cell viability by 50% (IC50) of F-ara-A and PEITC in F-ara-A–sensitive (n = 22) and –resistant (n = 18) CLL cells. Cells with an IC50 < 10 μM F-ara-A were considered fludarabine-sensitive, whereas those with an IC50 > 10 μM were considered fludarabine-resistant.
Figure 2
Figure 2
Selective killing of primary CLL cells by PEITC. (A) Cytotoxicity of PEITC in primary CLL cells (n = 6, black solid symbols) and normal lymphocytes (n = 4, open symbols), after 30-hour incubation detected by MTT assay. Each data point represents the mean of duplicate measurements. (B) Comparison of the mean IC50 of PEITC in CLL cells (n = 13) and normal lymphocytes (n = 11). Each bar represents the mean and 95% CI. (C) Cell death induced by 5 μM PEITC (24 hours) in primary CLL cells and normal lymphocytes detected by flow cytometric analysis (annexin V/PI double staining). Representative dot plots are shown. (D) Quantitative comparison of cell death induced by PEITC (5 μM, 24 hours) as in C. Percentage of drug-induced cell death was calculated by subtracting the spontaneous death in the control from the overall cell death in the PEITC-treated samples for each time point. The black and white bar represents the mean and 95% CI of 18 CLL patient samples and 7 normal blood samples, respectively. (E) Induction of ROS increase in primary CLL cells and normal lymphocytes by PEITC (5 μM, 2 hours), detected by flow cytometry using 1 μM DCF-DA. Representative histograms for CLL cells and normal lymphocytes are shown.
Figure 3
Figure 3
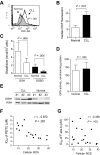
Alterations of redox states in primary CLL cells. (A) Increase of basal ROS in primary CLL cells, detected by flow cytometry using 1 μM DCF-DA. Representative histograms for CLL cells and normal lymphocytes are shown. (B) Quantitative comparison of the basal ROS levels between normal lymphocytes and primary CLL cells from 12 healthy donors and 33 CLL patients. Each bar represents the mean and 95% CI. (C) Decrease of basal reduced and oxidized glutathione (GSH and GSSG) in primary CLL cells (n = 9), compared with that of normal lymphocytes (n = 5). Each bar represents the mean and 95% CI. (D) GPX enzyme activities of normal lymphocytes (n = 4) and primary CLL cells (n = 8). Each bar represents the mean and 95% CI. (E) Basal expression levels of glutathione synthesis enzyme GCS (GSH1) in lymphocytes from 3 healthy donors and 3 CLL patient samples. (F) Correlation between the IC50 values of PEITC (MTT assay) and the basal ROS levels in primary CLL cells (n = 18). Spearman correlation coefficient r = −0.872, P < .001. (G) Lack of correlation between the IC50 values of F-ara-A (MTT assay) and basal ROS levels in primary CLL cells (n = 21). Spearman correlation coefficient r = −0.368, P = .100.
Figure 4
Figure 4
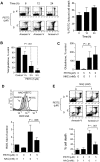
PEITC killed CLL cells mediated by glutathione depletion of ROS stress. (A) Time course of CLL cell killing by 5 μM PEITC, analyzed by annexin-PI assay. Representative dot plots (left panel) and quantitation of cell death (right panel) are shown. Percentage of drug-induced cell death was calculated by subtracting the spontaneous cell death from the overall cell death in the PEITC-treated sample. Each bar represents the mean and 95% CI (n = 23). (B) Depletion of cellular glutathione in CLL cells after exposure to 5 μM PEITC for indicated times. Each bar represents the mean and 95% CI (n = 9 CLL samples for each time point). (C) Effect of NAC on PEITC-induced glutathione depletion. CLL cells were preincubated with 1 mM NAC for 1 hour before exposure to 5 μM PEITC for 5 hours. Each bar represents the mean and 95% CI (n = 4). (D) Effect of NAC on PEITC-induced ROS accumulation is shown. CLL cells were preincubated with 1 mM NAC for 1 hour before exposure to 5 μM PEITC for 2 hours. Each bar represents the mean and 95% CI from assays of 3 different CLL samples. (E) Effect of NAC on PEITC-induced cell death. CLL cells were pre-incubated with 1 mM NAC for 1 hour before exposure to 5 μM PEITC for 24 hours. Cell death was detected by annexin/PI assay. Each bar represents the mean and 95% CI from assays of 7 CLL samples.
Figure 5
Figure 5
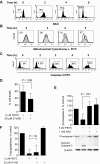
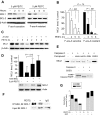
PEITC induces CLL cell death through oxidative damage to mitochondria. (A) Induction of oxidative damage to cardiolipin in CLL cells by PEITC (5 μM). Cardiolipin oxidation was measured by flow cytometry using NAO staining. M1 indicates the gating of the subpopulation of CLL cells that lost cardiolipin signal due to oxidation. Representative histograms of the time course experiments in a CLL patient sample are shown. Similar results were obtained using another sample. (B) Loss of mitochondrial cytochrome c induced by 5 μM PEITC in CLL cells. The overlays of the control (gray shade) and PEITC-treated (black line) samples show the distribution of mitochondrial cytochrome c fluorescent intensity of each cell population, with the mean value of the relative intensity indicated. Representative histograms of a CLL patient sample are shown. Similar results were obtained using another sample. (C) Caspase-3 activation in CLL cells treated with 5 μM PEITC, measured by flow cytometry using FITC-conjugated antibody specific for active caspase-3. M1 indicates the gating of subpopulation of cells with positive caspase-3 activation. Representative histograms of a CLL patient sample are shown. Similar results were obtained using 2 other different patient samples. (D) Partial suppression of PEITC-induced cell death by Z-VAD-fmk. CLL cells were preincubated with 20 μM Z-VAD-fmk for 30 minutes before incubation with 5 μM PEITC for 24 hours. Cell death was detected by annexin V/PI assay. Each bar represents the mean and 95% CI (n = 5 CLL samples). (E) Suppression of PEITC-induced caspase-3 activation by NAC. CLL cells were preincubated with 1 mM NAC for 1 hour before incubation with 5 μM PEITC for 5 hours. Procaspase-3 was detected by Western blot and quantified by densitometry and normalized with β-actin. Each bar represents the mean and 95% CI of 3 different CLL samples. (F) No effect of Z-VAD-fmk on PEITC-induced glutathione depletion was found. CLL cells were preincubated with 20 μM Z-VAD-fmk for 30 minutes before incubation with 5 μM PEITC for 5 hours. Each bar represents the mean and 95% CI of 3 different CLL samples.
Figure 6
Figure 6
Effect of PEITC on MCL1 stability and its glutathionylation state in CLL cells. (A) Time-dependent effect of 5 μM PEITC on MCL1 and BCL2 protein levels in F-ara-A–sensitive and –resistant CLL cells, detected by Western blot analysis. (B) Quantitation of MCL1 protein after exposure to PEITC as described in panel A. Each bar represents the mean and 95% CI from 7 F-ara-A–sensitive or 6 of F-ara-A–resistant CLL patient samples. (C) Suppression of PEITC-induced MCL1 degradation by caspase inhibitor Z-VAD-fmk. Cells were pretreated with 20 μM Z-VAD-fmk for 30 minutes before exposure to 5 μM PEITC. A representative Western blot from experiments with a CLL sample is shown. Similar results were obtained using another sample. (D) Suppression of PEITC-induced MCL1 degradation by NAC. CLL cells were preincubated with 1 mM NAC for 1 hour before exposure to 5 μM PEITC for 5 hours. Each bar represents the mean and 95% CI of 4 different CLL samples. (E) Glutathionylation prevented caspase-3–mediated cleavage of MCL1 in vitro. Dialyzed CLL lysates were incubated with 0.5 mM NADH, 0.5 mM NADPH, 2 mM GSH, or 2 mM GSSG for 10 minutes, and then exposed to recombinant caspase-3 for 60 minutes. Cleavage of MCL or PARP was detected by Western blot analysis. Representative results are shown. (F) PEITC treatment reduced the level of glutathionylation of MCL1 in CLL cells. CLL cells were exposed to 5 μM PEITC for 2.5 hours. Glutathionylated protein was immunoprecipitated (IP) using anti-GSH, and the levels of glutathionylated MCL-1 were analyzed using immunoblotting (IB) with anti-MCL1 antibody. Because PEITC induces rapid degradation of MCL1 protein, 3-fold higher amount of protein from the PEITC-treated sample was used for IP (input) to allow the detection of MCL1 signal. (G) Depletion of total glutathione and ratio of GSH/GSSG after 5 μM PEITC treatment as in panel F. Addition of 1 mM NAC restored cellular glutathione. Each stacked bar (GSH/GSSG) represents the average of duplicate measurements.
Figure 7
Figure 7
Comparison of residual viable cells after treatment with F-ara-A or PEITC. (A) Representative cell viability curves of F-ara-A–sensitive CLL cells treated with various concentrations of F-ara-A or PEITC for 72 hours and cell viability was measured by MTT assay. (B) Representative cell viability curves of F-ara-A–resistant CLL cells treated with various concentrations of F-ara-A or PEITC for 72 hours. (C) Quantitative comparison of percentage of viable cells after treatment with 20 μM F-ara-A or 10 μM PEITC (72 hours, MTT assay) in F-ara-A–sensitive and –resistant CLL cells. Each data point represents the mean of triplicate measurements for each patient sample. (D) Comparison of cellular thiols in control (untreated) CLL cells and in the residual viable CLL cells after treatment with 20 μM F-ara-A for 72 hours, using CMFDA and annexin V–PE dual staining flow cytometric analysis. Viable cells were defined as annexin V–negative subpopulation, which was gated as R1 (D left and middle panels). Cellular thiol levels in the R1 cell population of the control sample and the F-ara-A–treated sample were shown on the right panel. Representative plots of 3 different patients are shown.

Similar articles

Cited by

References

    1. Keating MJ, Chiorazzi N, Messmer B, et al. Biology and treatment of chronic lymphocytic leukemia. Hematology Am Soc Hematol Educ Program. 2003;1:153–175. - PubMed
    1. Elter T, Hallek M, Engert A. Fludarabine in chronic lymphocytic leukaemia. Expert Opin Pharmacother. 2006;7:1641–1651. - PubMed
    1. Byrd JC, Lin TS, Grever MR. Treatment of relapsed chronic lymphocytic leukemia: old and new therapies. Semin Oncol. 2006;33:210–219. - PubMed
    1. Turgut B, Vural O, Pala FS, et al. 17p Deletion is associated with resistance of B-cell chronic lymphocytic leukemia cells to in vitro fludarabine-induced apoptosis. Leuk Lymphoma. 2007;48:311–220. - PubMed
    1. Grever MR, Lucas DM, Dewald GW, et al. Comprehensive assessment of genetic and molecular features predicting outcome in patients with chronic lymphocytic leukemia: results from the US Intergroup Phase III Trial E2997. J Clin Oncol. 2007;25:799–804. - PubMed

Publication types

MeSH terms