Distinctive in vitro effects of T-cell growth cytokines on cytomegalovirus-stimulated T-cell responses of HIV-infected HAART recipients
- PMID: 18572217
- PMCID: PMC2593685
- DOI: 10.1016/j.virol.2008.05.018
Distinctive in vitro effects of T-cell growth cytokines on cytomegalovirus-stimulated T-cell responses of HIV-infected HAART recipients
Abstract
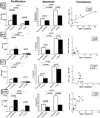
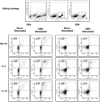
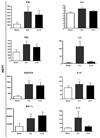
Functional immune reconstitution is limited after HAART, maintaining the interest in adjunctive immune-modulators. We compared in vitro the effects of the gamma-chain T-cell growth cytokines IL-2, IL-4, IL-7 and IL-15 on cytomegalovirus-stimulated cell-mediated immunity. IL-2 and IL-15 increased cytomegalovirus-specific lymphocyte proliferation in HAART recipients, whereas IL-4 and IL-7 did not. The boosting effect of IL-2 and IL-15 on proliferation correlated with their ability to prevent late apoptosis. However, IL-2 increased the frequency of cells in early apoptosis, whereas IL-15 increased the frequency of fully viable cells. Both IL-2 and IL-15 increased cytomegalovirus-induced CD4+ and CD8+ T-cell proliferation and the synthesis of Th1 and pro-inflammatory cytokines and chemokines. However, only IL-2 increased the frequency of regulatory T cells and Th2 cytokine production, both of which have the potential to attenuate antiviral immune responses. Overall, compared to other gamma-chain cytokines, IL-15 had the most favorable profile for boosting antiviral cell-mediated immunity.
Figures


Similar articles
-
Interleukin-21 and cellular activation concurrently induce potent cytotoxic function and promote antiviral activity in human CD8 T cells.Hum Immunol. 2011 Feb;72(2):115-23. doi: 10.1016/j.humimm.2010.10.015. Epub 2010 Oct 25. Hum Immunol. 2011. PMID: 20977918 Free PMC article.
-
Role of common gamma chain utilizing cytokines for immune reconstitution in HIV infection.Immunol Res. 2007;38(1-3):373-86. doi: 10.1007/s12026-007-0036-9. Immunol Res. 2007. PMID: 17917047
-
Regulatory T cells generated during cytomegalovirus in vitro stimulation of mononuclear cells from HIV-infected individuals on HAART correlate with decreased lymphocyte proliferation.Virology. 2006 Sep 1;352(2):408-17. doi: 10.1016/j.virol.2006.04.035. Epub 2006 Jun 19. Virology. 2006. PMID: 16782163
-
Cytokines and HIV-1: interactions and clinical implications.Antivir Chem Chemother. 2001 May;12(3):133-50. doi: 10.1177/095632020101200301. Antivir Chem Chemother. 2001. PMID: 12959322 Review.
-
Prospect of IL-2, IL-7, IL-15 and IL-21 for HIV immune-based therapy.Zhong Nan Da Xue Xue Bao Yi Xue Ban. 2011 Nov;36(11):1037-45. doi: 10.3969/j.issn.1672-7347.2011.11.002. Zhong Nan Da Xue Xue Bao Yi Xue Ban. 2011. PMID: 22169717 Review.
Cited by
-
T cell responses to cytomegalovirus.Nat Rev Immunol. 2016 Jun;16(6):367-77. doi: 10.1038/nri.2016.38. Epub 2016 Apr 25. Nat Rev Immunol. 2016. PMID: 27108521 Review.
-
T-lymphocyte subtyping: an early warning and a potential prognostic indicator of active cytomegalovirus infection in patients with sepsis.Immunol Cell Biol. 2022 Nov;100(10):777-790. doi: 10.1111/imcb.12586. Epub 2022 Oct 12. Immunol Cell Biol. 2022. PMID: 36106958 Free PMC article.
-
Epstein-Barr virus- and cytomegalovirus-specific immune response in patients with brain cancer.J Transl Med. 2018 Jul 3;16(1):182. doi: 10.1186/s12967-018-1557-9. J Transl Med. 2018. PMID: 29970101 Free PMC article.
References
-
- Adachi Y, Oyaizu N, Than S, McCloskey TW, Pahwa S. IL-2 rescues in vitro lymphocyte apoptosis in patients with HIV infection: correlation with its ability to block culture-induced down-modulation of Bcl-2. J Immunol. 1996;157(9):4184–4193. - PubMed
-
- Alpdogan O, Eng JM, Muriglan SJ, Willis LM, Hubbard VM, Tjoe KH, Terwey TH, Kochman A, van den Brink MR. Interleukin-15 enhances immune reconstitution after allogeneic bone marrow transplantation. Blood. 2005;105(2):865–873. - PubMed
-
- Anderson PO, Sundstedt A, Yazici Z, Minaee S, O'Neill EJ, Woolf R, Nicolson K, Whitley N, Li L, Li S, Wraith DC, Wang P. IL-2 overcomes the unresponsiveness but fails to reverse the regulatory function of antigen-induced T regulatory cells. J Immunol. 2005;174(1):310–319. - PubMed
-
- Berard M, Brandt K, Bulfone-Paus S, Tough DF. IL-15 promotes the survival of naive and memory phenotype CD8+ T cells. J Immunol. 2003;170(10):5018–5026. - PubMed
-
- Burgdorf S, Kautz A, Bohnert V, Knolle PA, Kurts C. Distinct pathways of antigen uptake and intracellular routing in CD4 and CD8 T cell activation. Science. 2007;316(5824):612–616. - PubMed
Publication types
MeSH terms
Substances
Grants and funding
LinkOut - more resources
Full Text Sources
Medical
Research Materials

