. 2008 Oct;22(7):1024-1031.
doi: 10.1016/j.bbi.2008.04.006. Epub 2008 Jun 13.

Stimulatory and suppressive signal transduction regulates vasoactive intestinal peptide receptor-1 (VPAC-1) in primary mouse CD4 T cells

Affiliations

Stimulatory and suppressive signal transduction regulates vasoactive intestinal peptide receptor-1 (VPAC-1) in primary mouse CD4 T cells

Emilie E Vomhof-DeKrey et al. Brain Behav Immun. 2008 Oct.

Abstract

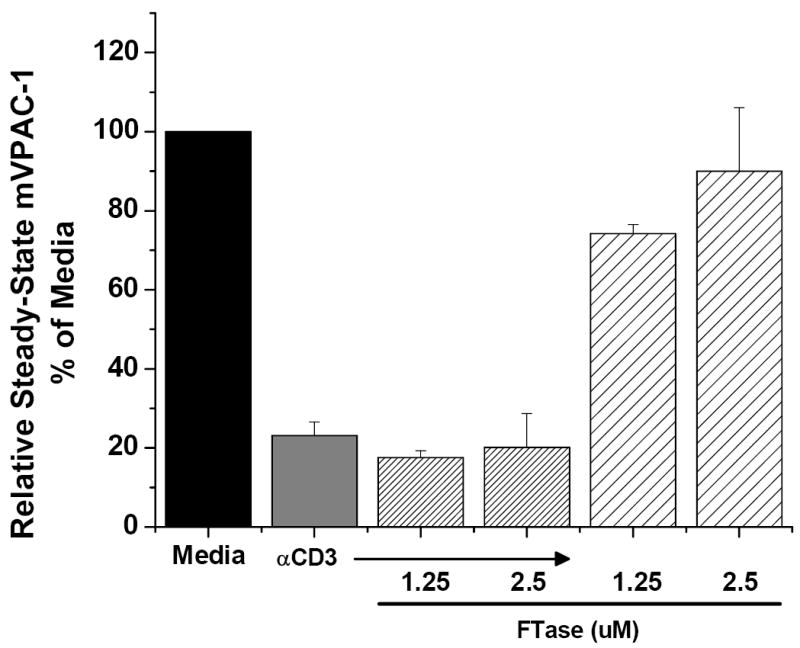
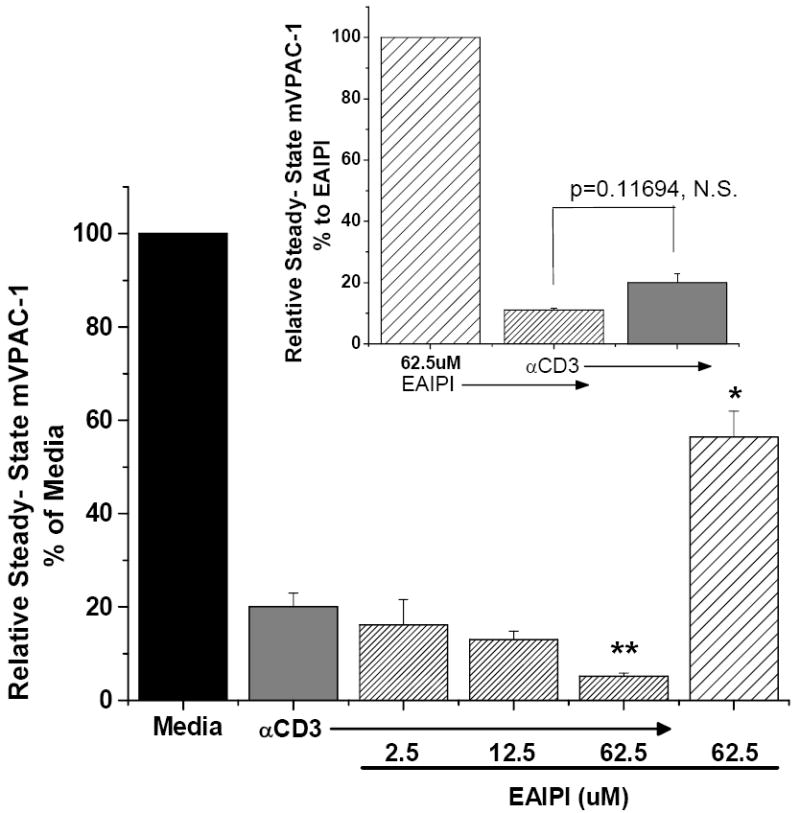
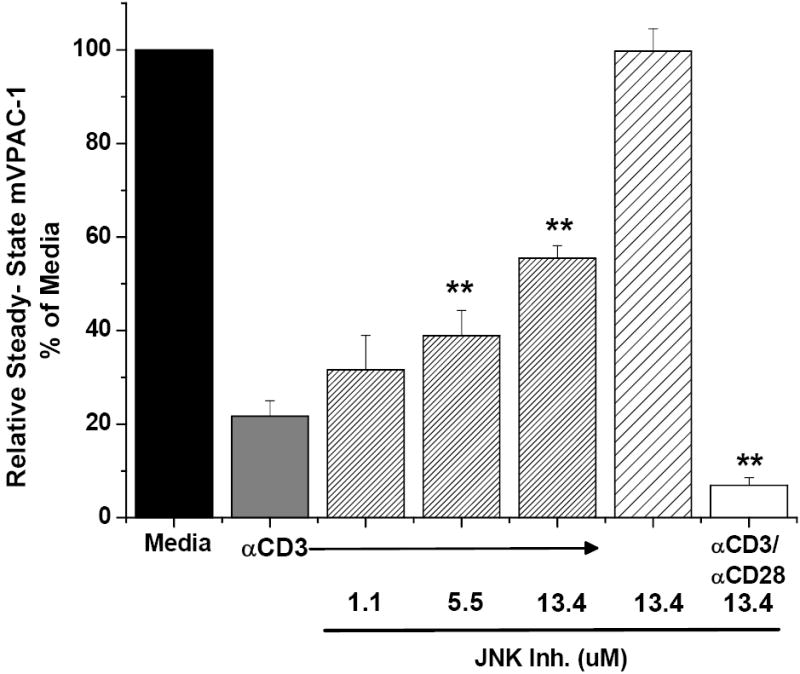
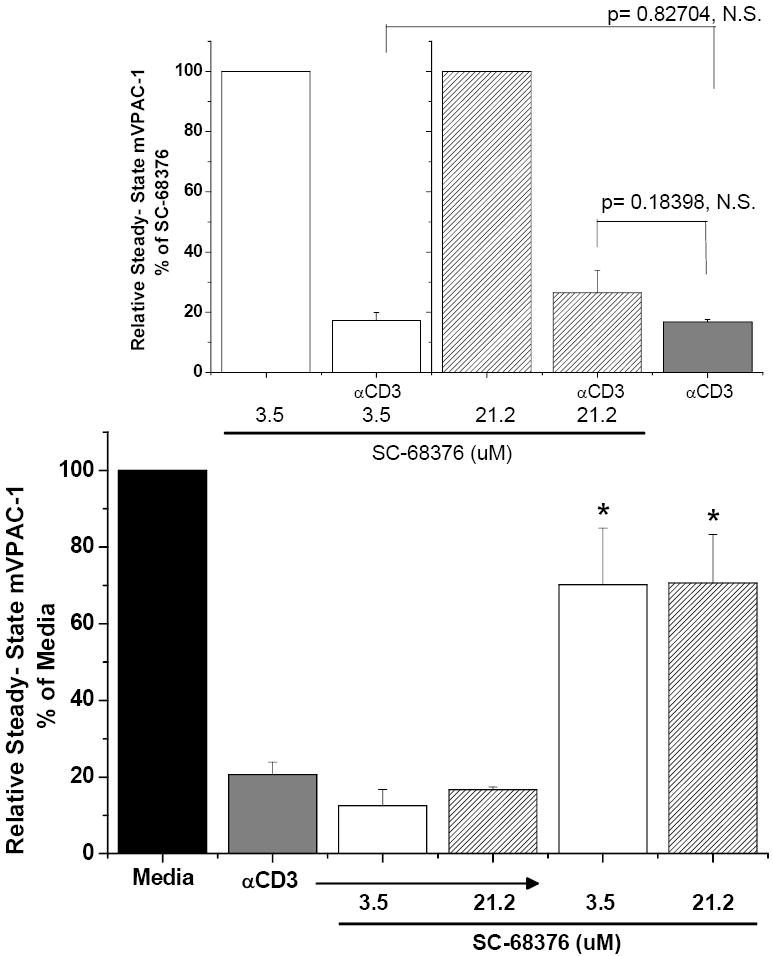
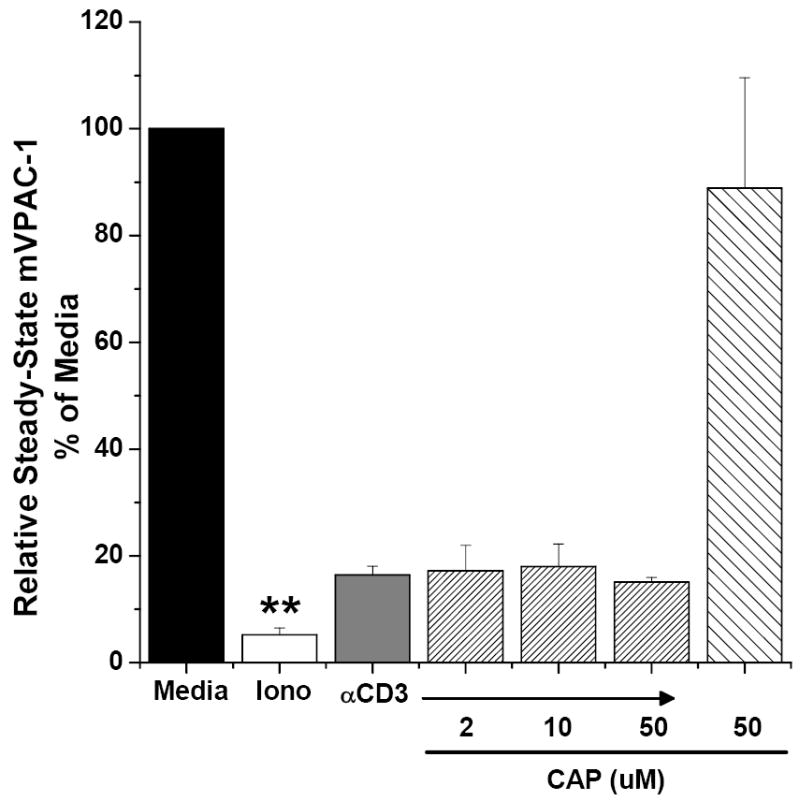
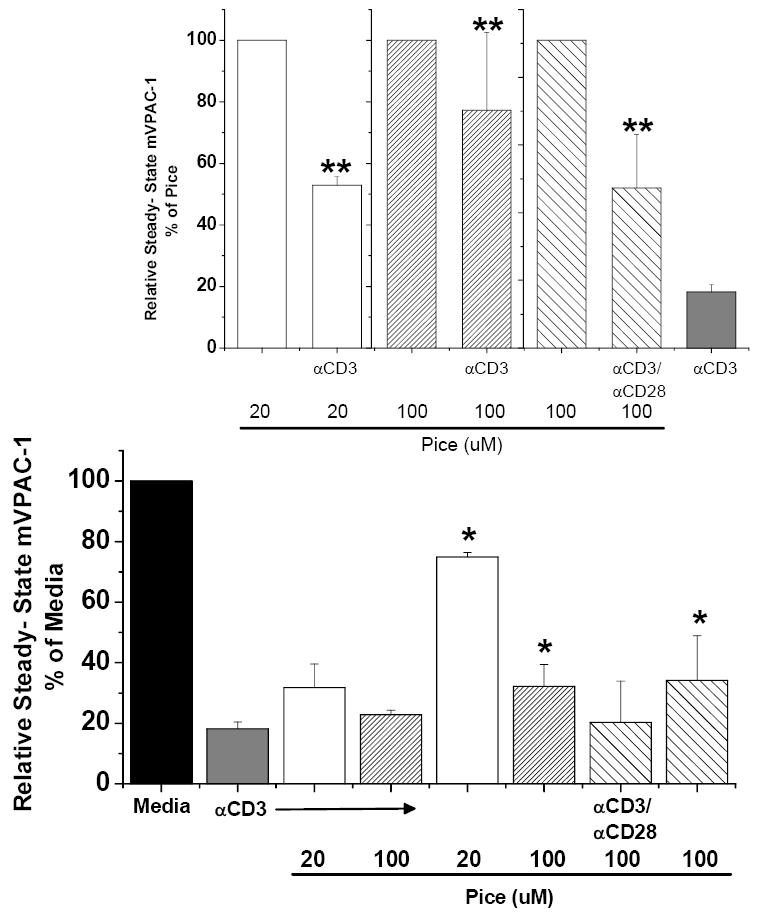
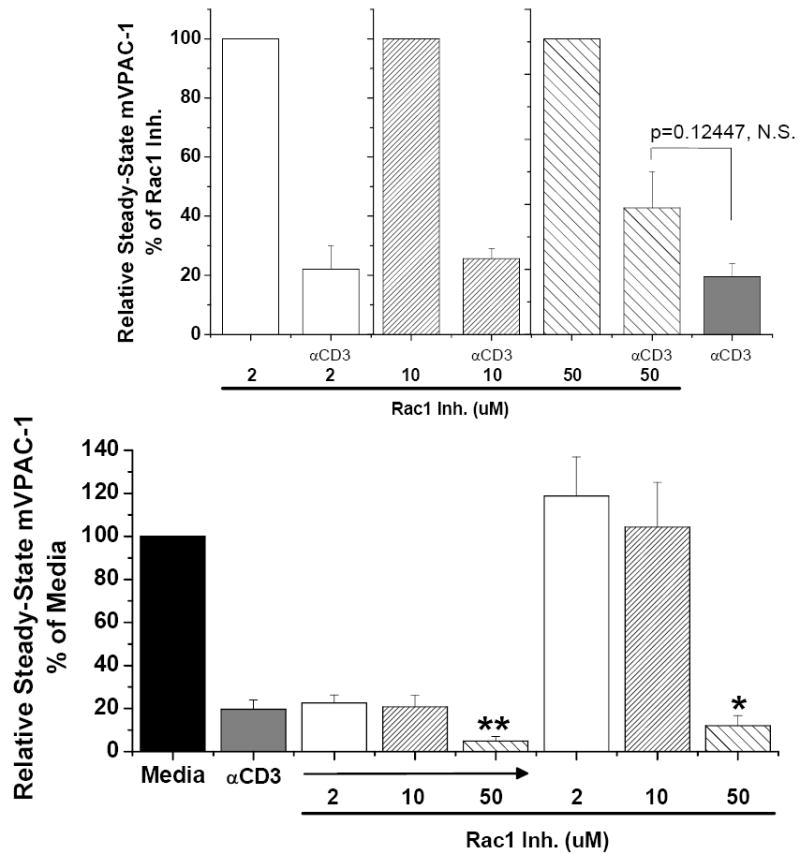
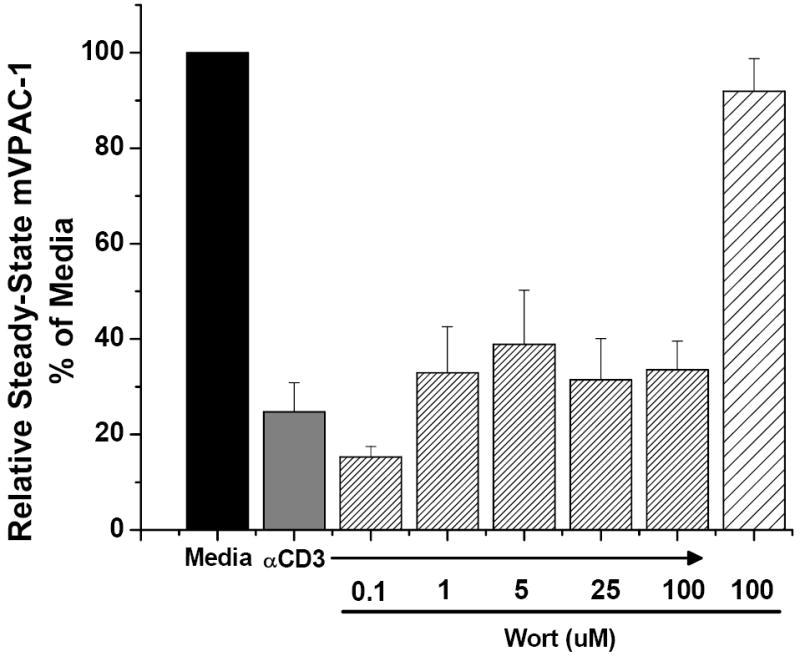
Vasoactive intestinal peptide receptor-1 (VPAC-1) is an anti-proliferative, G-protein coupled receptor that is highly expressed on naïve T cells, and has been reported to be downregulated upon T cell activation. The T cell signaling molecules involved in mediating low VPAC-1 levels have not been identified. Therefore, to gain a greater understanding into this regulation, this study investigated the signaling pathways that regulate (VPAC-1) in murine, primary CD4 T cells. To this end, murine, splenic CD4 T cells were pretreated separately with 10 different pharmacological inhibitors and incubated +/- anti-CD3 for 24h. Total RNA was isolated, and VPAC-1 mRNA levels were measured by qPCR. Our results support that JNK kinases, downstream from the protein kinase, Zap70, are involved in suppressive regulation of VPAC-1 steady-state mRNA levels after anti-CD3 treatment. In contrast, inhibitors against PKC, ERK, p38, Zap70 and Rac1 supported a stimulatory influence in VPAC-1 regulation in the absence of T cell signaling. By studying the signaling pathways that regulate VPAC-1 in T cells, we can gain greater insight into the role of this anti-inflammatory receptor in autoimmunity and infectious diseases.


Figures

Fig. 1
Fig. 1
Schematic Representation of T Cell Receptor Evoked Signal Transduction. Several major pathways are represented downstream of the Src-kinases, Fyn/Lck, including the PLCγ, PKC, Ras, PI3-K, Vav/Rac1, ERK, JNK and p38 MAPK pathways. Candidate transcription factors that each pathway is known to activate are included. Names of the pharmacological inhibitors used in this study and their selective protein target are represented. PIP2= phosphatidylinositol phosphate, Fyn/Lck= Src family kinases PP2= 4-Amino-5-(4-chlorophenyl)-7-(t-butyl)pyrazolo[3,4-d]pyrimidine PLCγ= phospholipase Cγ, DAG= diacylglyceride, PKC= protein kinase C, IP3= inositolphosphate-3, PI3-K= phosphatidylinositol-3-kinase, PMA= phorbol 12-myristate 13- acetate, NFAT-p= nuclear factor of activated T cells, AKT= v-Akt murine thymoma viral oncogene, Ras= reticular activating system protein, Raf= a serine/threonine-selective protein kinase, MEK= MAP/ERK kinase, ERK= extracellular signal regulated kinase, NFκB= nuclear factor κB, Zap70= ξ associated protein 70, LAT= linker for activation of T cells, GRB2= growth factor receptor binding protein 2, SOS1= sons of sevenless, Vav= oncogene Vav, Rac1= Ras-Related C3 Botulinum Toxin substrate, MEKK1= MAP/ERK kinase kinase 1, MKK3/6= MAP kinase kinase 3/6, MKK4/7= MAP kinase kinase 4/7, p38= also known as SAPK= stress activated protein kinase, JNK= c-Jun NH2 terminal kinase, ATF2= activating transcription factor 2, FA=farnesyl.
Fig. 2
Fig. 2
PMA and anti-CD3 treatment induces low levels of VPAC-1 that is not reversed by inhibitors against PKC or Ras. Purified CD4 T cells were seeded at 1 or 4×10⁶ cells/ml for 24 hours, total RNA isolated and relative VPAC-1 mRNA levels measured by qPCR (Materials and Methods). VPAC-1 levels from media alone were arbitrarily set to 100% (* = p≤0.05 as compared to media alone; ** = p≤0.05 as compared to 5ng/ml PMA).A. Cells used immediately (naïve) or incubated for 24 hrs +/- anti-CD3 (4 μg/ml) or anti-CD3/anti-CD28 (2.5μg/ml) B. Cells treated with increasing concentrations of phorbol 12-myristate 13-acetate (PMA) as indicated, or with 8.1uM PMA ± various inhibitor concentrations as indicated against Fyn/Lck (PP2), PKC (staurosporine; Stauro) or Ras (FTase Inhibitor II; FTase). C. Cells were treated with media control, inhibitor alone (Stauro) or plate-bound 4μg/ml anti-CD3 (α-CD3) with increasing concentrations of staurosporine or D. FTase Inhibitor II. Inset: Insert graphs are inhibitor alone normalized to 100%, and inhibitor alone plus αCD3 in an attempt to compare relative changes in VPAC-1 levels compared to α-CD3.
Fig. 2
Fig. 2
PMA and anti-CD3 treatment induces low levels of VPAC-1 that is not reversed by inhibitors against PKC or Ras. Purified CD4 T cells were seeded at 1 or 4×10⁶ cells/ml for 24 hours, total RNA isolated and relative VPAC-1 mRNA levels measured by qPCR (Materials and Methods). VPAC-1 levels from media alone were arbitrarily set to 100% (* = p≤0.05 as compared to media alone; ** = p≤0.05 as compared to 5ng/ml PMA).A. Cells used immediately (naïve) or incubated for 24 hrs +/- anti-CD3 (4 μg/ml) or anti-CD3/anti-CD28 (2.5μg/ml) B. Cells treated with increasing concentrations of phorbol 12-myristate 13-acetate (PMA) as indicated, or with 8.1uM PMA ± various inhibitor concentrations as indicated against Fyn/Lck (PP2), PKC (staurosporine; Stauro) or Ras (FTase Inhibitor II; FTase). C. Cells were treated with media control, inhibitor alone (Stauro) or plate-bound 4μg/ml anti-CD3 (α-CD3) with increasing concentrations of staurosporine or D. FTase Inhibitor II. Inset: Insert graphs are inhibitor alone normalized to 100%, and inhibitor alone plus αCD3 in an attempt to compare relative changes in VPAC-1 levels compared to α-CD3.
Fig. 3
Fig. 3
JNK inhibitor V reverses anti-CD3, but anti-CD3/anti-CD28, induced low levels of VPAC-1. Purified CD4 T cells were incubated for 24 hours, total RNA isolated and VPAC-1 levels assessed by qPCR (Materials and Methods). Media VPAC-1 levels were arbitrarily set to 100% (* = p≤0.05 as compared to media alone; ** = p≤0.05 as compared to anti-CD3). Cells were seeded at 4×10⁶ cells/ml in media alone, inhibitor alone or with 4 μg/ml anti-CD3 (αCD3) +/- increasing concentrations of A. ERK activation inhibitor peptide I, B. JNK inhibitor V and C. the p38 inhibitor SC-68376. Inset: Insert graphs are inhibitor alone normalized to 100%, and inhibitor alone plus αCD3 in an attempt to compare relative changes in VPAC-1 levels compared to α-CD3.
Fig. 3
Fig. 3
JNK inhibitor V reverses anti-CD3, but anti-CD3/anti-CD28, induced low levels of VPAC-1. Purified CD4 T cells were incubated for 24 hours, total RNA isolated and VPAC-1 levels assessed by qPCR (Materials and Methods). Media VPAC-1 levels were arbitrarily set to 100% (* = p≤0.05 as compared to media alone; ** = p≤0.05 as compared to anti-CD3). Cells were seeded at 4×10⁶ cells/ml in media alone, inhibitor alone or with 4 μg/ml anti-CD3 (αCD3) +/- increasing concentrations of A. ERK activation inhibitor peptide I, B. JNK inhibitor V and C. the p38 inhibitor SC-68376. Inset: Insert graphs are inhibitor alone normalized to 100%, and inhibitor alone plus αCD3 in an attempt to compare relative changes in VPAC-1 levels compared to α-CD3.
Fig. 4
Fig. 4
Calcineurin does not mediate TCR induced negative regulation during T cell activation. Purified CD4 T cells were incubated for 24 hours, total RNA isolated and VPAC-1 levels assessed by qPCR (Materials and Methods). Media VPAC-1 levels were arbitrarily set to 100%. Cells were seeded at 1 or 4×10⁶ cells/ml and incubated in media alone or 1μg/ml ionomycin, or incubated with media alone, inhibitor alone (CAP (Calcineurin Autoinhibitory Peptide) or anti-CD3 (αCD3) +/- increasing concentrations of calcineurin autohibitory peptide.
Fig. 5
Fig. 5
A pharmacological inhibitor against Zap70 regulates VPAC-1 in an opposite manner dependent on TCR signaling. Purified CD4 T cells were incubated for 24 hours, total RNA isolated and VPAC-1 levels were assessed by qPCR (Materials and Methods). Media VPAC-1 levels were arbitrarily set to 100% (* = p≤0.05 as compared to media alone; **= p≤0.05 as compared to anti-CD3). Cells were seeded at 1 or 4×10⁶ cells/ml and incubated for 24 hours in media alone, inhibitors alone or with α-CD3 (1 or 4 μg/ml) +/- increasing concentrations of A. piceatannol, and +/- αCD3/αCD28, B. Rac1 inhibitor or C. wortmanin. Inset: Insert graphs are inhibitor alone normalized to 100%, and inhibitor alone plus αCD3 in an attempt to compare relative changes in VPAC-1 levels compared to α-CD3.
Fig. 5
Fig. 5
A pharmacological inhibitor against Zap70 regulates VPAC-1 in an opposite manner dependent on TCR signaling. Purified CD4 T cells were incubated for 24 hours, total RNA isolated and VPAC-1 levels were assessed by qPCR (Materials and Methods). Media VPAC-1 levels were arbitrarily set to 100% (* = p≤0.05 as compared to media alone; **= p≤0.05 as compared to anti-CD3). Cells were seeded at 1 or 4×10⁶ cells/ml and incubated for 24 hours in media alone, inhibitors alone or with α-CD3 (1 or 4 μg/ml) +/- increasing concentrations of A. piceatannol, and +/- αCD3/αCD28, B. Rac1 inhibitor or C. wortmanin. Inset: Insert graphs are inhibitor alone normalized to 100%, and inhibitor alone plus αCD3 in an attempt to compare relative changes in VPAC-1 levels compared to α-CD3.

Similar articles

Cited by

References

    1. Arcaro A, Wymann MP. Wortmannin is a potent phosphatidylinositol 3-kinase inhibitor: the role of phosphatidylinositol 3,4,5-triphosphate in neutrophil responses. Biochem J. 1993;296:297–301. - PMC - PubMed
    1. Béné MC. What is ZAP-70? Cytometry B Clin Cytom. 2006 Jul 15;70(4):204–8. - PubMed
    1. Bruno S, Ardelt B, Skierski JS, Traganos F, Darzynkiewicz Z. Different effects of Staurosporine, an inhibitor of protein kinases, on the cell cycle and chromatin structure of normal and leukemic lymphocytes. Cancer Res. 1992;52:470–473. - PubMed
    1. Clayburgh DR, Barrett TA, Tang Y, Meddings JB, Van Eldik LJ, Watterson DM, Clarke LL, Mrsny RJ, Turner JR. Epithelial myosin light chain kinasedependent barrier dysfunction mediated T cell activation-induced diarrhea in vivo. J Clin Invest. 2005;115:2702–2715. - PMC - PubMed
    1. Clements JL, Boerth NJ, Lee JR, Koretzky GA. Integration of T cell receptor-dependent signaling pathways by adapter proteins. Annu Rev Immunol. 1999;17:89–108. - PubMed

Publication types

MeSH terms

Substances