

Cantharidin induces apoptosis of human multiple myeloma cells via inhibition of the JAK/STAT pathway
- PMID: 18544087
- PMCID: PMC11158712
- DOI: 10.1111/j.1349-7006.2008.00872.x
Cantharidin induces apoptosis of human multiple myeloma cells via inhibition of the JAK/STAT pathway
Abstract
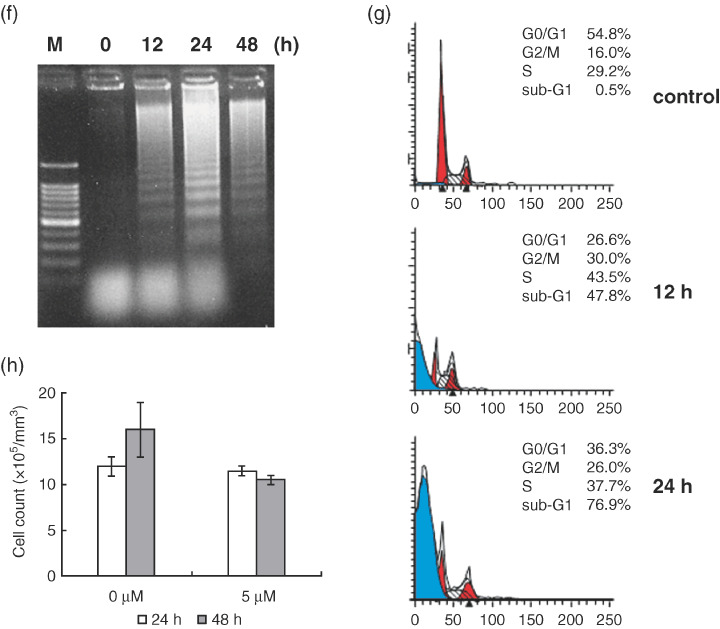
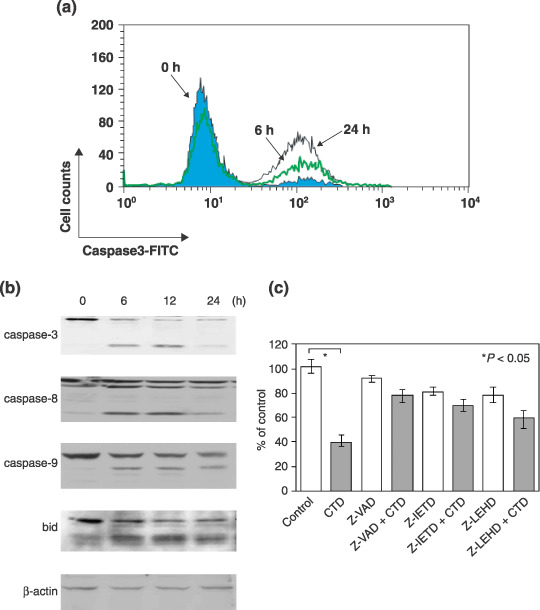
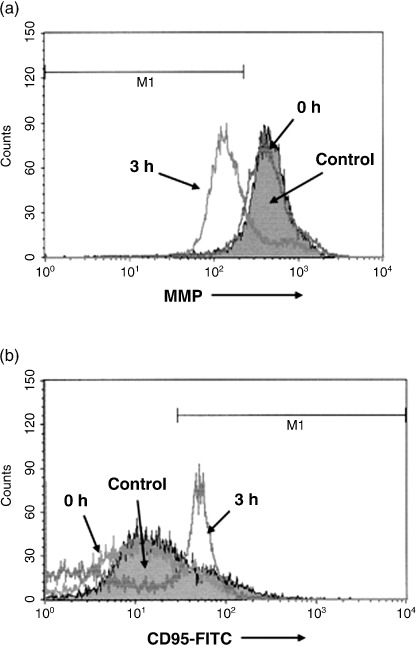
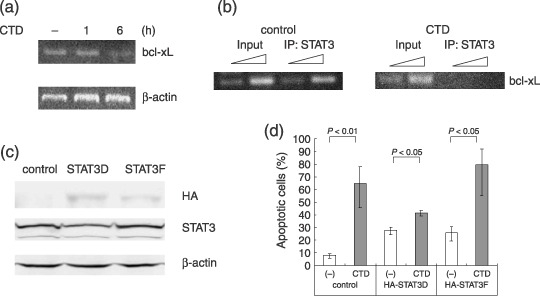
Multiple myeloma is an incurable B-cell malignancy requiring new therapeutic strategies in clinical settings. Interleukin (IL)-6 signaling pathways play a critical role in the pathogenesis of multiple myeloma. The traditional Chinese medicine cantharidin (CTD) has been shown to inhibit cellular proliferation and induce apoptosis of various cancer cells. The aim of this study was to investigate the possibility of CTD as a novel therapeutic agent for the patients with multiple myeloma. We investigated the in vitro effects of CTD for its antimyeloma activity, and further examined the molecular mechanisms of CTD-induced apoptosis. CTD inhibited the cellular growth of human myeloma cell lines as well as freshly isolated myeloma cells in patients. Cultivation with CTD induced apoptosis of myeloma cells in a cell-cycle-independent manner. Treatment with CTD induced caspase-3, -8, and -9 activities, and it was completely blocked by each caspase inhibitor. We further examined the effect of CTD on the IL-6 signaling pathway in myeloma cells, and found that CTD inhibited phosphorylation of STAT3 at tyrosine 705 residue as early as 1 h after treatment and down-regulated the expression of the antiapoptotic bcl-xL protein. STAT3 directly bound and activated the transcription of bcl-xL gene promoter, resulting in the induction of the expression of bcl-xL in myeloma cells. The essential role of STAT3 in CTD effects was confirmed by transfection with the constitutively active and dominant negative form of STAT3 in U266 cells. In conclusion, we have demonstrated that CTD is a promising candidate to be a new therapeutic agent in signal transduction therapy.
Figures


Similar articles
-
Cantharidin induces apoptosis of H460 human lung cancer cells through mitochondria-dependent pathways.Int J Oncol. 2014 Jul;45(1):245-54. doi: 10.3892/ijo.2014.2428. Epub 2014 May 9. Int J Oncol. 2014. PMID: 24818581
-
Cantharidin induces G2/M phase arrest and apoptosis in human colorectal cancer colo 205 cells through inhibition of CDK1 activity and caspase-dependent signaling pathways.Int J Oncol. 2011 Apr;38(4):1067-73. doi: 10.3892/ijo.2011.922. Epub 2011 Jan 24. Int J Oncol. 2011. PMID: 21271215
-
4-Chlorobenzoyl berbamine, a novel berbamine derivative, induces apoptosis in multiple myeloma cells through the IL-6 signal transduction pathway and increases FOXO3a-Bim expression.Oncol Rep. 2013 Jul;30(1):425-32. doi: 10.3892/or.2013.2431. Epub 2013 Apr 26. Oncol Rep. 2013. PMID: 23624712
-
Defining the role of the JAK-STAT pathway in head and neck and thoracic malignancies: implications for future therapeutic approaches.Drug Resist Updat. 2010 Jun;13(3):67-78. doi: 10.1016/j.drup.2010.04.001. Epub 2010 May 14. Drug Resist Updat. 2010. PMID: 20471303 Review.
-
IL-6 activated JAK/STAT3 pathway and sensitivity to Hsp90 inhibitors in multiple myeloma.Curr Med Chem. 2014;21(26):3042-7. doi: 10.2174/0929867321666140414100831. Curr Med Chem. 2014. PMID: 24735367 Review.
Cited by
-
Cantharidin and its anhydride-modified derivatives: relation of structure to insecticidal activity.Int J Mol Sci. 2012 Dec 20;14(1):1-16. doi: 10.3390/ijms14010001. Int J Mol Sci. 2012. PMID: 23344017 Free PMC article.
-
Cantharidin Induced Oral Squamous Cell Carcinoma Cell Apoptosis via the JNK-Regulated Mitochondria and Endoplasmic Reticulum Stress-Related Signaling Pathways.PLoS One. 2016 Dec 8;11(12):e0168095. doi: 10.1371/journal.pone.0168095. eCollection 2016. PLoS One. 2016. PMID: 27930712 Free PMC article.
-
Cantharidin, a potent and selective PP2A inhibitor, induces an oxidative stress-independent growth inhibition of pancreatic cancer cells through G2/M cell-cycle arrest and apoptosis.Cancer Sci. 2010 May;101(5):1226-33. doi: 10.1111/j.1349-7006.2010.01523.x. Epub 2010 Feb 5. Cancer Sci. 2010. PMID: 20331621 Free PMC article.
-
Cantharidin induces G2/M phase arrest and apoptosis in human gastric cancer SGC-7901 and BGC-823 cells.Oncol Lett. 2014 Dec;8(6):2721-2726. doi: 10.3892/ol.2014.2611. Epub 2014 Oct 10. Oncol Lett. 2014. PMID: 25364455 Free PMC article.
-
The DEAD box protein p68: a novel coactivator of Stat3 in mediating oncogenesis.Oncogene. 2017 Jun 1;36(22):3080-3093. doi: 10.1038/onc.2016.449. Epub 2016 Dec 12. Oncogene. 2017. PMID: 27941883
References
-
- Hideshima T, Anderson KC. Molecular mechanisms of novel therapeutic approaches for multiple myeloma. Nat Rev Cancer 2002; 2: 927–37. - PubMed
-
- Weber D. Thalidomide and its derivatives: new promise for multiple myeloma. Cancer Control 2003; 10: 375–83. - PubMed
-
- Yasui H, Hideshima T, Richardson PG, Anderson KC. Recent advances in the treatment of multiple myeloma. Curr Pharm Biotechnol 2006; 7: 381–93. - PubMed
-
- Hideshima T, Bergsagel PL, Kuehl WM, Anderson KC. Advances in biology of multiple myeloma: clinical applications. Blood 2004; 104: 607–18. - PubMed
-
- Miyakoshi S, Kami M, Yuji K et al . Severe pulmonary complications in Japanese patients after bortezomib treatment for refractory multiple myeloma. Blood 2006; 107: 3492–4. - PubMed
Publication types
MeSH terms
Substances
LinkOut - more resources
Full Text Sources
Molecular Biology Databases
Research Materials
Miscellaneous
