. 2008 Jul 25;283(30):20628-34.
doi: 10.1074/jbc.M800738200. Epub 2008 Jun 4.

Synaptic vesicle protein 2 binds adenine nucleotides

Affiliations

Synaptic vesicle protein 2 binds adenine nucleotides

Jia Yao et al. J Biol Chem. .

Erratum in

  • J Biol Chem. 2008 Sep 5;283(36):25103

Abstract

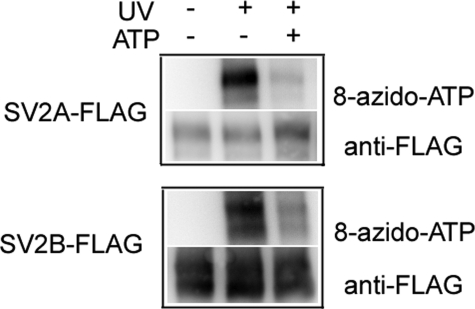
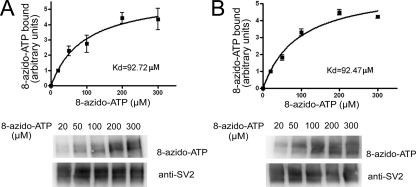
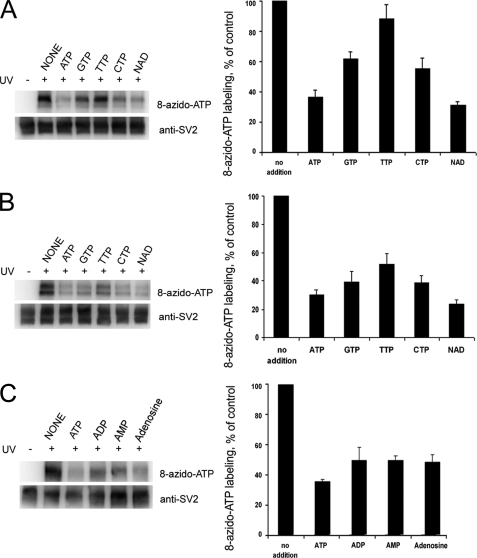
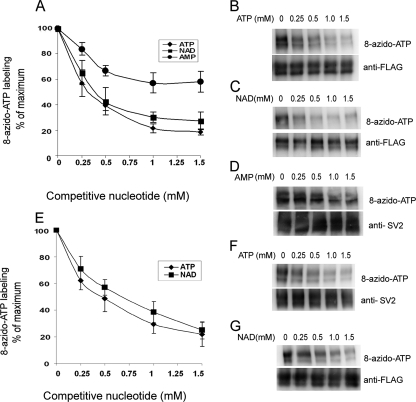
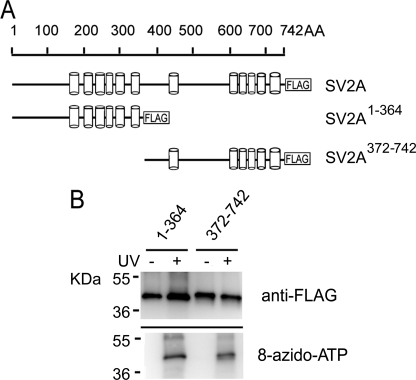
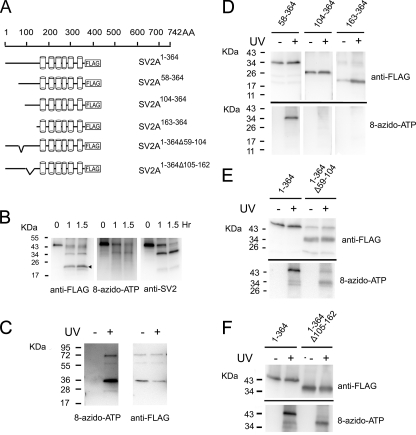
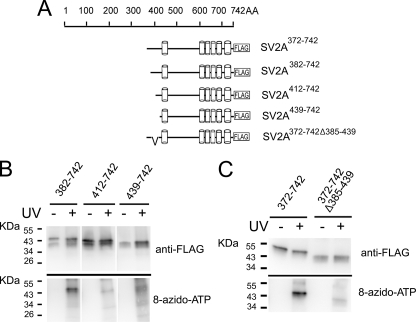
Synaptic vesicle protein 2 (SV2) is required for normal calcium-regulated secretion of hormones and neurotransmitters. Neurons lacking the two most widely expressed isoforms, SV2A and SV2B, have a reduced readily releasable pool of synaptic vesicles, indicating that SV2 contributes to vesicle priming. The presence of putative ATP-binding sites in SV2 suggested that SV2 might be an ATP-binding protein. To explore this, we examined the binding of the photoaffinity reagent 8-azido-ATP[gamma] biotin to purified, recombinant SV2 in the presence and absence of other nucleotides. Our results indicate that SV2A and SV2B bind nucleotides, with the highest affinity for adenine-containing nucleotides. SV2A contains two binding sites located in the cytoplasmic domains preceding the first and seventh transmembrane domains. These results suggest that SV2-mediated vesicle priming could be regulated by adenine nucleotides, which might provide a link between cellular energy levels and regulated secretion.


Figures

FIGURE 1.
FIGURE 1.
Purified SV2A-FLAG and SV2B-FLAG bind 8-azido-ATP-biotin. Recombinant SV2A-FLAG and SV2B-FLAG fusion proteins were purified from transfected HEK293 cells as described under “Materials and Methods.” Labeling reactions contained ∼5 μg of protein and 100 μm 8-azido-ATP in the presence or absence of 1 mm nonphotoreactive ATP. Control reactions that did not receive UV irradiation were run in parallel. The samples were resolved by SDS-PAGE and transferred to polyvinylidene difluoride membrane. Bound 8-azido-ATP was visualized by ExtrAvidin-HRP and SV2-FLAG fusion proteins were detected with anti-FLAG antibody.
FIGURE 2.
FIGURE 2.
SV2A and SV2B demonstrate sub-millimolar affinity for ATP. Purified SV2A-FLAG (A) and SV2B-FLAG (B) were labeled with the indicated concentrations of 8-azido-ATP-biotin and subjected to SDS-PAGE and Western analysis. The net intensity of labeled bands was quantified as described under “Materials and Methods.” The data are expressed as the intensity of 8-azido-ATP labeling normalized to SV2 protein detected by Western analysis. Representative Western blots are shown for each series. The error bars represent the S.E. (n = 3).
FIGURE 3.
FIGURE 3.
ATP and NAD are the most effective at inhibiting SV2 binding to 8-azido-ATP. The ability of different nucleotides to compete with 8-azido-ATP binding was assessed. SV2A-FLAG (A) and SV2B-FLAG (B) were labeled with 100μm 8-azido-ATP in the absence or presence of 1 mm of the indicated nucleotide. The samples were subjected to SDS-PAGE and Western analysis and quantified as described under “Materials and Methods.” The results represent the means ± S.E. of six experiments for SV2A and five experiments for SV2B. C shows the specificity of different adenine nucleotides binding to SV2A-FLAG. The error bars represent S.E. (n = 4).
FIGURE 4.
FIGURE 4.
NAD and ATP demonstrate similar affinities for SV2. AD, SV2A-FLAG was labeled with 100 μm 8-azido-ATP in the absence or presence of ATP, NAD or AMP (0.25–1.5 mm). The data were expressed as the percentage of 8-azido-ATP labeling in control reactions. Representative blots of SV2A labeling in the presence of different concentrations of ATP (B), NAD (C), or AMP (D) are shown. EG, similar studies were done with SV2B-FLAG. The error bars represent the S.E. (n = 3).
FIGURE 5.
FIGURE 5.
SV2A contains nucleotide binding sites on both N- and C-terminal halves. A, schematic structures of SV2A and its mutants used for mapping studies. Cylinders represent transmembrane domains. A FLAG epitope was attached to the C termini of the proteins. B, both the N-terminal and C-terminal halves of SV2A contain ATP-binding sites. N- and C-terminal halves of recombinant SV2A-FLAG were subjected to photoaffinity labeling as described under “Materials and Methods.”
FIGURE 6.
FIGURE 6.
Mapping the nucleotide binding site in the N terminus of SV2A. A, schematic of SV2A1–364 FLAG fusion proteins and truncation and deletion mutants. The cylinders represent transmembrane domains. Discontinuous lines represent deleted residues. B, an ATP-binding site located in the first 170 amino acids of SV2A. Shown are the results of trypsin digestion of 8-azido-ATP labeled SV2A1–364. Labeled protein was digested at 37 °C in the presence of trypsin. At the time periods indicated, an aliquot was withdrawn and subjected to analysis as described under “Materials and Methods.” The arrowhead indicates a 21-kDa proteolytic fragment, which is recognized by anti-FLAG but was not labeled by 8-azido-ATP. C, a FLAG fusion peptide containing SV2A a.a. 1–163 binds ATP. Photoaffinity labeling reactions were performed with 1 μg of purified peptide and analyzed as described under “Materials and Methods.” The predominant band at ∼35 kDa is larger than the predicted molecular mass of the peptide (19 kDa) and most likely represents a dimer. D, amino acids 58–104 are required for nucleotide binding. Serial truncations of SV2A1–364 were subjected to photoaffinity labeling as described under “Materials and Methods.” Only SV2A1–364 and SV2A58–364 bound 8-azido-ATP[γ] biotin indicating that a.a. 58–104 are critical for nucleotide binding. We note that the apparent molecular masses of SV2A104–364 and SV2A163–364 are about 25.5 and 19.5 kDa, respectively, which is smaller than the calculated molecular mass based on the amino acids sequences (29.6 and 23.4 kDa, respectively). We interpret this difference to be due to the highly hydrophobic nature of these proteins, which is likely to influence their migration in gel electrophoresis. E, amino acids 58–104 contribute to nucleotide binding. SV2A1–364 lacking residues 59–104 was subjected to photoaffinity labeling. 8-azido-ATP labeling was decreased by an average of 36% (n = 3). A representative Western blot is shown. F, amino acids 105–162 are required for nucleotide binding. SV2A1–364 lacking residues 105–162 was subjected to photoaffinity labeling. Deletion of these residues reduced binding by an average of 65%. Shown is a representative example of three independent experiments.
FIGURE 7.
FIGURE 7.
Mapping the nucleotide binding site in the C-terminal half of SV2A. A, schematic structure of SV2A372–742 FLAG fusion proteins depicting truncation and deletion mutants. The cylinders represent transmembrane domains. The discontinuous lines in the N terminus of SV2A372–742 represent the deleted amino acids residues. B, the nucleotide-binding site in the C-terminal half of SV2A resides between a.a. 382–439. Serial truncations of the C-terminal half of SV2A were subjected to photoaffinity labeling as described under “Materials and Methods.” SV2A382–742 bound 8-azido-ATP[γ] biotin, whereas SV2A412–742 demonstrated reduced binding, and SV2A439–742 showed almost no binding indicating a binding site between a.a. 382–439. C, deletion of a.a. 385–439 decreased nucleotide binding by an average of 64%. Shown is a representative example of three independent experiments.
FIGURE 8.
FIGURE 8.
Expression of SV2A does not increase ATP transport into HEK293 cell microsomes. HEK293 cells were transfected with either pIRES2-EGFP (control) or SV2A-pIRES2-EGFP constructs. The cells were harvested 24–48 h after transfection, and transport of 3H-ATP into microsomal membranes was measured using a filter binding assay as described under “Materials and Methods.” A, results of four independent experiments done in duplicate. The error bars represent the S.E. B, transport was distinguished from binding by measuring [3H]ATP remaining after washing filters with buffer containing 2% Triton X-100, which disrupts membranes and displaces transported substrate. The data are from a single representative experiment. The error bars represent the standard deviation of duplicate reactions.

Similar articles

Cited by

References

    1. Buckley, K. M., Floor, E., and Kelly, R. B. (1987) J. Cell Biol. 105 2447–2456 - PMC - PubMed
    1. Bajjalieh, S. M., Peterson, K., Linial, M., and Scheller, R. H. (1993) Proc. Natl. Acad. Sci. U. S. A. 90 2150–2154 - PMC - PubMed
    1. Bajjalieh, S. M., Peterson, K., Shinghal, R., and Scheller, R. H. (1992) Science 257 1271–1273 - PubMed
    1. Feany, M. B., Lee, S., Edwards, R. H., and Buckley, K. M. (1992) Cell 70 861–867 - PubMed
    1. Janz, R., Hofmann, K., and Sudhof, T. C. (1998) J. Neurosci. 15 9269–9281 - PMC - PubMed

Publication types

LinkOut - more resources