. 2008 Aug 1;283(31):21799-807.
doi: 10.1074/jbc.M709628200. Epub 2008 May 28.

Analysis of the synaptotagmin family during reconstituted membrane fusion. Uncovering a class of inhibitory isoforms

Affiliations

Analysis of the synaptotagmin family during reconstituted membrane fusion. Uncovering a class of inhibitory isoforms

Akhil Bhalla et al. J Biol Chem. .

Abstract

Ca(2+)-triggered exocytosis in neurons and neuroendocrine cells is regulated by the Ca(2+)-binding protein synaptotagmin (syt) I. Sixteen additional isoforms of syt have been identified, but little is known concerning their biochemical or functional properties. Here, we assessed the abilities of fourteen syt isoforms to directly regulate SNARE (soluble N-ethylmaleimide-sensitive factor (NSF) attachment protein receptor)-catalyzed membrane fusion. One group of isoforms stimulated neuronal SNARE-mediated fusion in response to Ca(2+), while another set inhibited SNARE catalyzed fusion in both the absence and presence of Ca(2+). Biochemical analysis revealed a strong correlation between the ability of syt isoforms to bind 1,2-dioleoyl phosphatidylserine (PS) and t-SNAREs in a Ca(2+)-promoted manner with their abilities to enhance fusion, further establishing PS and SNAREs as critical effectors for syt action. The ability of syt I to efficiently stimulate fusion was specific for certain SNARE pairs, suggesting that syts might contribute to the specificity of intracellular membrane fusion reactions. Finally, a subset of inhibitory syts down-regulated the ability of syt I to activate fusion, demonstrating that syt isoforms can modulate the function of each other.


Figures
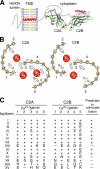
FIGURE 1.
FIGURE 1.
Conservation of the putative Ca2+ ligands among different isoforms of syt. A, model depicting the structure of syt. The image was generated using the crystal structure of the cytoplasmic domain of syt III (37); remaining segments were added with a drawing program. B, schematic diagram showing the five Ca2+-coordinating residues in the C2A and C2B domains of syt I. The diagram is modified and reproduced with permission from the authors of Ref. . C, conservation among the Ca2+ ligands in the C2A and C2B domains of syt I-XIII and XV. Numbers correspond to the order of the five aspartate residues that function as Ca2+ ligands in the C2A domain of syt I (D172, 178, 230, 232, 238) and C2B (D303, 309, 363, 365, 371) (6). Single letter codes indicate substitutions of conserved aspartate residues; (+) denotes conservation of an aspartate, and (-) indicates a gap. Based on conservation of the Ca2+ ligands, we predicted which syts might (+) and might not (-) stimulate in vitro SNARE-mediated fusion in response to Ca2+.
FIGURE 2.
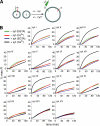
FIGURE 2.
Normalized fusion data from fourteen isoforms of syt. A, illustration depicting the in vitro fusion assay used in this study. Fusion of v-SNARE (syb; v) vesicles, containing a donor (D) and acceptor (A) FRET pair, with unlabeled t-SNARE vesicles (syntaxin 1A/SNAP-25B; t), results in dilution of the FRET pair and an increase in donor fluorescence. B, syt isoforms differentially regulate fusion between v- and t-SNARE vesicles. Fusion was monitored for 120 min at 37 °C in the absence (-syt) or presence (+syt, 10 μm) of different syt isoforms, normalized to the maximum donor fluorescence signal (% max Fl), and plotted as a function of time. Reactions were carried out in 0.2 mm EGTA or 1 mm Ca2+. Representative traces for the different syt isoforms are shown from ≥3 independent trials.
FIGURE 3.
FIGURE 3.
Syt isoforms differentially regulate neuronal SNARE-catalyzed membrane fusion. A, average extent of fusion (% max FI) at t = 120 min, in either 0.2 mm EGTA (open bars) or 1 mm Ca2+ (filled bars), was plotted for each syt isoform. (-)syt indicates fusion between v- and t-SNARE vesicles in the absence of syt. The data plotted here are averages across all trials. Error bars represent S.E. (n ≥ 3). B, average % stimulation in Ca2+ (fusion in Ca2+ compared with fusion in EGTA within each individual trial and then averaged; Equation 1 in “;Experimental Procedures”) was plotted for v- and t-SNARE-mediated fusion and for each syt isoform. Error bars represent S.E. (n ≥ 3). C, average % stimulation over (-)syt (fusion by Ca2+·syt compared with fusion mediated by SNAREs in the absence of syt within each individual trial and then averaged; Equation 2 in “;Experimental Procedures”) was plotted for each syt isoform. Error bars represent S.E. (n ≥ 3).
FIGURE 4.
FIGURE 4.
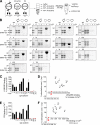
Syts differ in their ability to bind PS and t-SNAREs. A, diagram of the flotation assay used to monitor binding of the different syt isoforms to t-SNARE vesicles (t), or protein free vesicles, with (PF(+PS)) or without PS (PF). Syt will float to the top of the gradient only if it interacts with vesicles. After centrifugation, samples are collected from the top of the gradient and analyzed by SDS-PAGE; proteins are visualized by staining with Coomassie Blue. B, flotation assays were carried out as depicted in panel A. Binding was monitored in either 0.2 mm EGTA (-) or 1 mm Ca2+(+). A representative gel from three independent trials is shown for each syt isoform. For the syt IV gel only, a line was added between the t-SNARE and syt IV standards to indicate lanes that were originally spaced further apart on the same gel and were combined for this figure. C, amount of syt that co-floated with t-SNARE vesicles in 0.2 mm EGTA or 1 mm Ca2+ from panel B was quantified using densitometry and normalized to the syntaxin band in each lane. The average % increase in t-SNARE binding in the presence of Ca2+ versus EGTA was calculated using normalized data and plotted for each isoform. Error bars represent S.E. (n = 3). In panels C-F, red is used to denote the inhibitory syts indicated in Fig. 3C. D, for each syt isoform, % stimulation over syt (from Fig. 3C) was plotted against the average % increase in t-SNARE binding for each syt isoform from panel C. E, the amount of syt bound to PS-harboring vesicles in 1 mmCa2+ from panel B was quantified using densitometry. The average total optical density is plotted for each isoform (because there is no other band in each lane against which the syt signal can be normalized as in panel C). Error bars represent S.E. (n ≥ 3). F, % stimulation over (-)syt (from Fig. 3C) was plotted against the average amount of syt bound to PS-harboring vesicles in 1 mm Ca2+ from panel E.
FIGURE 5.
FIGURE 5.
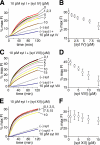
Syts IV and VIII, but not XII, inhibit syt I-mediated stimulation of membrane fusion. Syt I (10 μm) stimulates fusion between v- and t-SNARE vesicles in response to Ca2+ (panels A, C, and E, red trace). A, increasing concentrations of syt IV were added to fusion reactions containing 10 μm syt I and 1 mm Ca2+. Fusion was monitored for 120 min at 37 °C and plotted as % max Fl over time. B, average extent of fusion from the data in panel A (% max Fl) at t = 120 min was plotted as a function of [syt IV]. C, experiments were carried out as in panel A except syt VIII was used in place of syt IV. D, data from panel C were plotted as a function of [syt VIII]. E, experiments were carried out as in panel A except syt XII was used in place of syt IV. F, data from E were plotted as a function of [syt XII]. In all plots, error bars represent S.E. (n = 3).
FIGURE 6.
FIGURE 6.
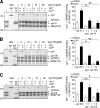
Syt isoforms compete with one another for binding to t-SNAREs. A, left, binding of syt I and IV to t-SNARE (t) vesicles was carried out in the absence (-) or presence (+) of Ca2+. Syts were assayed individually and in the indicated combinations using 10 μm each syt, or 10 μm syt I and 30 μm syt IV (representing a 1:1 and 1:3 molar ratio of syt I:competitor syt, respectively). One-third of each sample was subjected to SDS-PAGE; gels were stained with Coomassie Blue. Right, the amount of syt I bound to t-SNAREs was quantified by densitometry, normalized to the SNAP-25 band in each lane, and plotted as a percentage of SNAP-25. Data represent the average and S.E. from n ≥ 3. B, experiments were carried out as in panel A, except syt VIII was used in place of syt IV. C, experiments were carried out as in panel A, except syt XII was used in place of syt IV. Statistical analysis was carried out using a Student's t test; *, p < 0.05; **, p < 0.01; n.s. (not significant) p > 0.05. All gels are representative from ≥3 trials. In panel A only, the line on the gel (left panel) separates groups of lanes that were originally spaced further apart on the same gel and were combined for the figure.
FIGURE 7.
FIGURE 7.
Specificity of functional pairing between syt I and t-SNAREs. Fusion reactions were carried out as described in the legend to Fig. 2A using t-SNARE vesicles that harbored the indicated t-SNARE pairs and v-SNARE vesicles than harbored syb 2. Fusion was monitored in the absence (-syt) or presence (+syt) of 10 μm syt I in either 0.2 mm EGTA or 1 mm Ca2+ and plotted as the % max fluorescence intensity over time. Representative traces from three independent trials are shown.

Similar articles

Cited by

References

    1. Niemann, H., Blasi, J., and Jahn, R. (1994) Trends Cell Biol. 4 179-185 - PubMed
    1. Jahn, R., and Scheller, R. H. (2006) Nat. Rev. Mol. Cell Biol. 7 631-643 - PubMed
    1. Weber, T., Zemelman, B. V., McNew, J. A., Westermann, B., Gmachl, M., Parlati, F., Sollner, T. H., and Rothman, J. E. (1998) Cell 92 759-772 - PubMed
    1. Augustine, G. J. (2001) Curr. Opin. Neurobiol. 11 320-326 - PubMed
    1. Koh, T. W., and Bellen, H. J. (2003) Trends Neurosci. 26 413-422 - PubMed

Publication types