. 2008 May 27:5:11.
doi: 10.1186/1742-4682-5-11.

Introduction of an agent-based multi-scale modular architecture for dynamic knowledge representation of acute inflammation

Affiliations

Introduction of an agent-based multi-scale modular architecture for dynamic knowledge representation of acute inflammation

Gary An. Theor Biol Med Model. .

Abstract

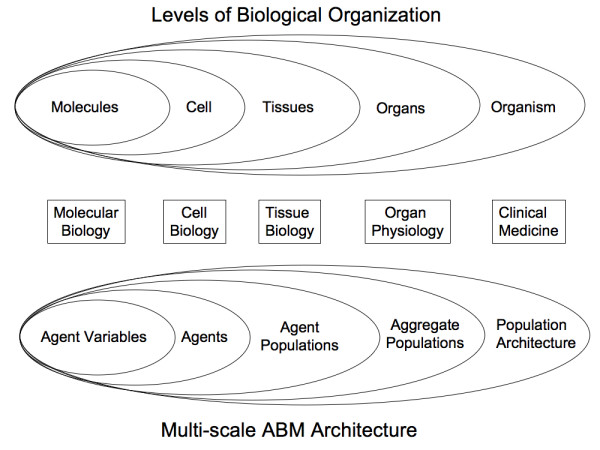
Background: One of the greatest challenges facing biomedical research is the integration and sharing of vast amounts of information, not only for individual researchers, but also for the community at large. Agent Based Modeling (ABM) can provide a means of addressing this challenge via a unifying translational architecture for dynamic knowledge representation. This paper presents a series of linked ABMs representing multiple levels of biological organization. They are intended to translate the knowledge derived from in vitro models of acute inflammation to clinically relevant phenomenon such as multiple organ failure.

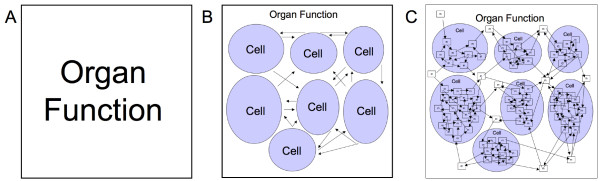
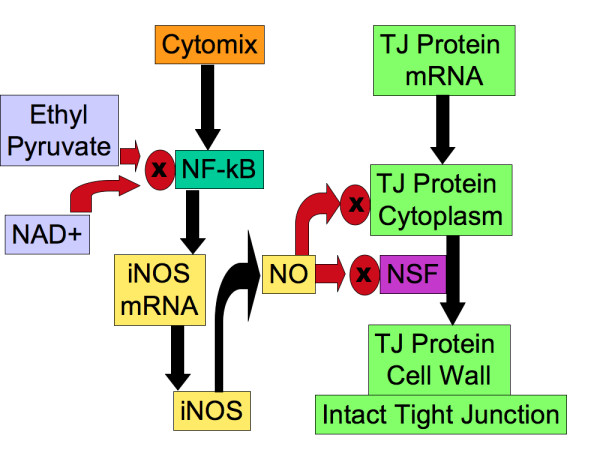
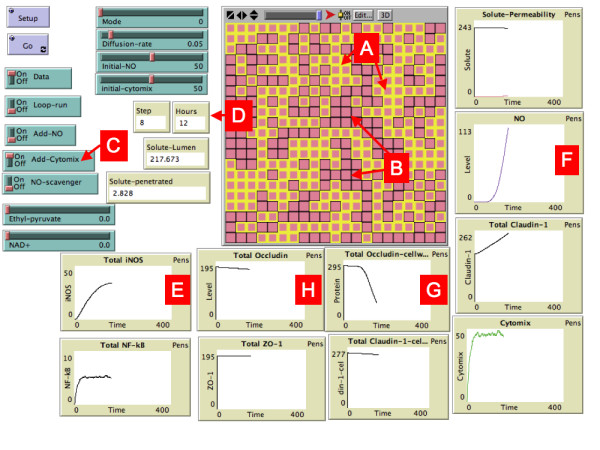
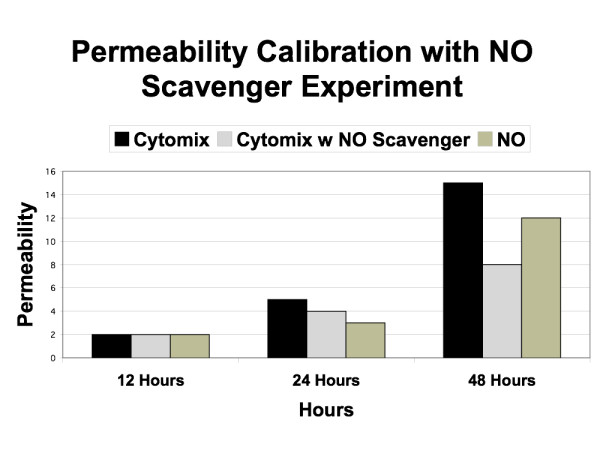
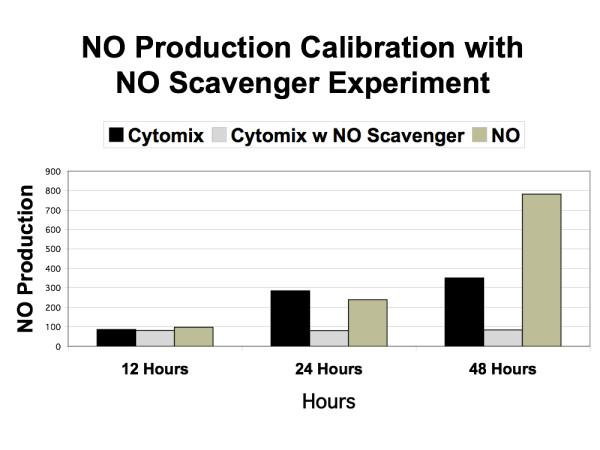
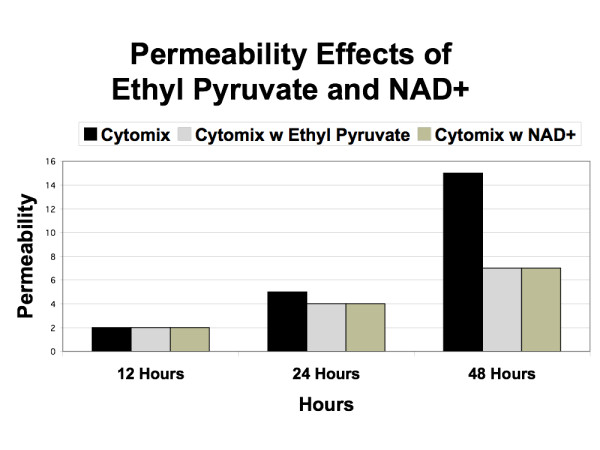
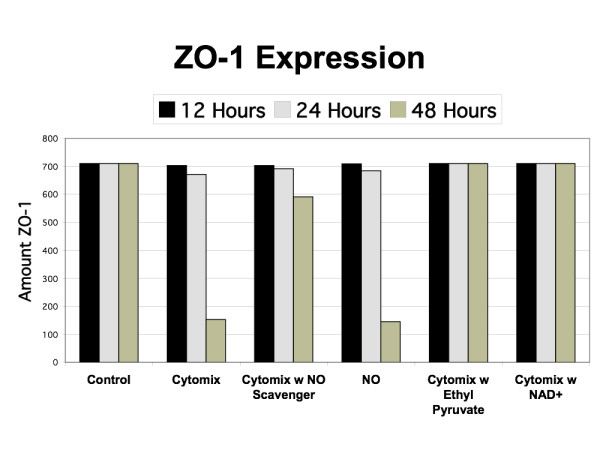
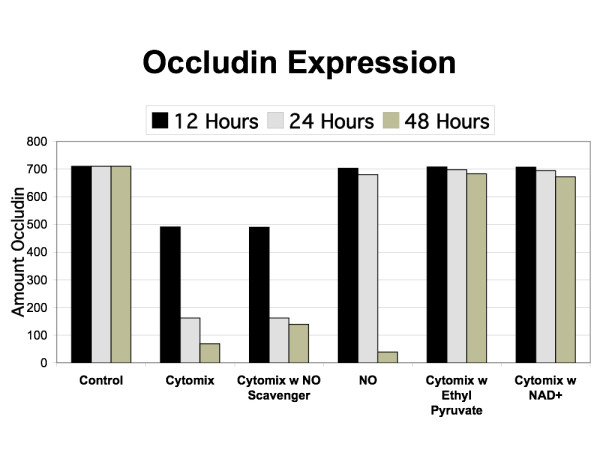
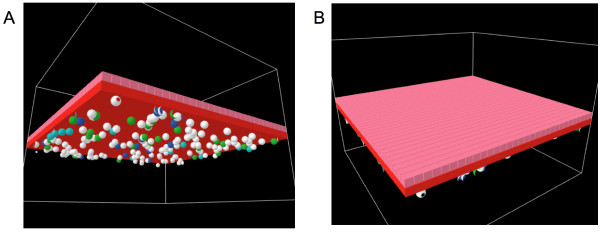
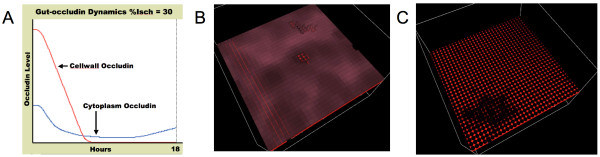
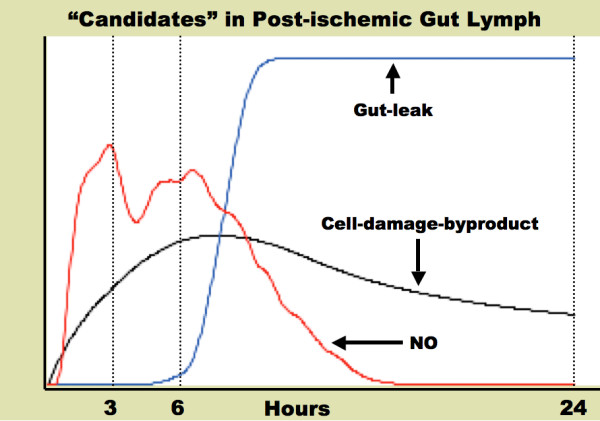
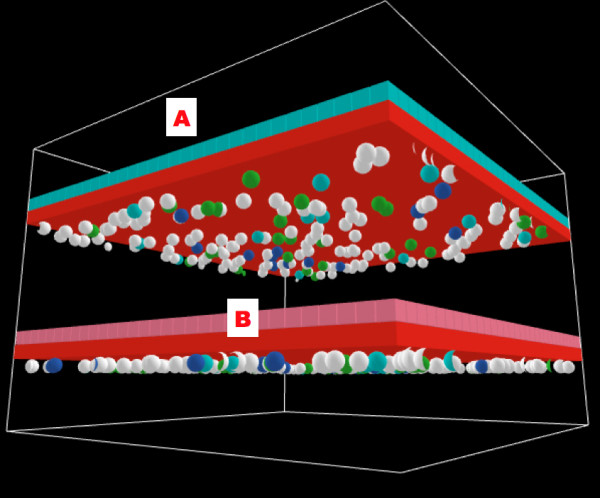
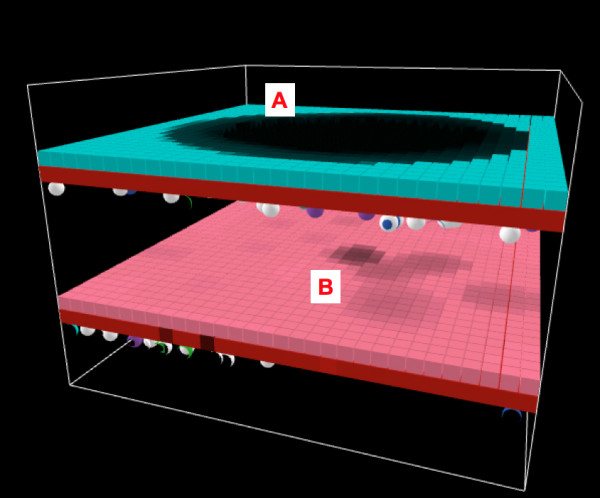
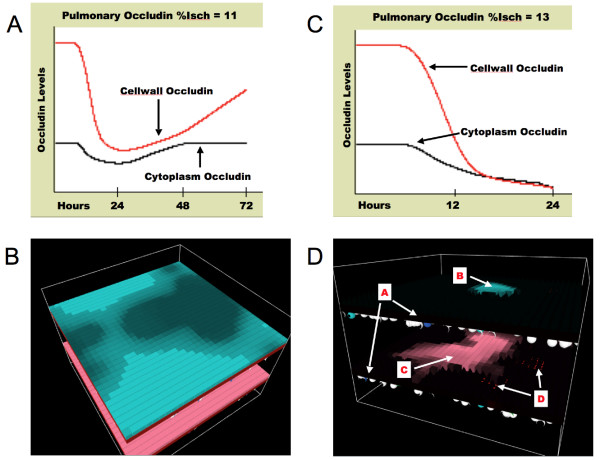
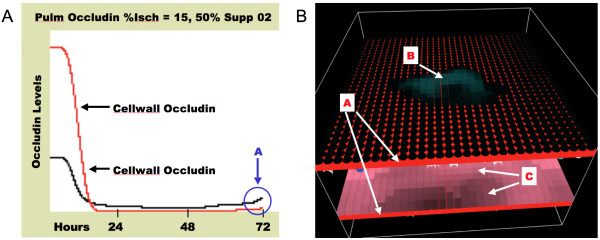
Results and discussion: ABM development followed a sequence starting with relatively direct translation from in-vitro derived rules into a cell-as-agent level ABM, leading on to concatenated ABMs into multi-tissue models, eventually resulting in topologically linked aggregate multi-tissue ABMs modeling organ-organ crosstalk. As an underlying design principle organs were considered to be functionally composed of an epithelial surface, which determined organ integrity, and an endothelial/blood interface, representing the reaction surface for the initiation and propagation of inflammation. The development of the epithelial ABM derived from an in-vitro model of gut epithelial permeability is described. Next, the epithelial ABM was concatenated with the endothelial/inflammatory cell ABM to produce an organ model of the gut. This model was validated against in-vivo models of the inflammatory response of the gut to ischemia. Finally, the gut ABM was linked to a similarly constructed pulmonary ABM to simulate the gut-pulmonary axis in the pathogenesis of multiple organ failure. The behavior of this model was validated against in-vivo and clinical observations on the cross-talk between these two organ systems.

Conclusion: A series of ABMs are presented extending from the level of intracellular mechanism to clinically observed behavior in the intensive care setting. The ABMs all utilize cell-level agents that encapsulate specific mechanistic knowledge extracted from in vitro experiments. The execution of the ABMs results in a dynamic representation of the multi-scale conceptual models derived from those experiments. These models represent a qualitative means of integrating basic scientific information on acute inflammation in a multi-scale, modular architecture as a means of conceptual model verification that can potentially be used to concatenate, communicate and advance community-wide knowledge.


Figures

Figure 1
Figure 1
Abstract demonstration of the expansion of information resulting from reductionist investigation of multi-scale biological systems. Figure 1a shows the highest level of clinically observed phenomenon at the organ level. Figure 1b demonstrates graphically the mechanistic knowledge that organ function results from the interactions of multiple cells and types of cells. Figure 1c illustrates what a conceptual mechanistic model would look like when a further finer grained level of resolution is used. Figure 1c represents where the overwhelming bulk of biomedical research is currently being conducted, particularly with respect to the search for drug candidates and mechanisms of disease. Note that the "indistinctness" of Figure 1c is intentional: attempts to "zoom in" on the Figure may increase local clarity, but at the cost of being able to see the range of potential consequences to a particular manipulation.
Figure 2
Figure 2
Multiple scales of Biological Organization, Biomedical Research and Multi-scale ABM Architecture. Representation of the multiple scales of biological organization and the ABM architecture in a nested fashion, to reflect the reliance of the higher scale behavior on the mechanisms operating at the lower levels. Of note, the biomedical research community structure in the middle is not so represented, to reflect the relative compartmentalization of the community with respect to the operational aspect of research, though obviously lower scale knowledge and information does influence the hypotheses generated and being tested at the higher scale.
Figure 3
Figure 3
Graphical Representation of the control logic extracted from the basic science references [24, 26, 27]on Gut Epithelial Barrier Function. General flowchart of the components and mechanisms of TJ protein synthesis and localization, the effects of pro-inflammatory stimulation, and the effects of interventions with ethyl pyruvate and NAD+. All labeled boxes correspond to agent or environment state variables within the EBABM. In the actual code of the EBABM there are distinct pathways for the different TJ proteins (not shown here for clarity purposes).
Figure 4
Figure 4
Screen shot of the Graphical User Interface of the EBABM. Control buttons are on the Left; Graphical Output of the simulation is in the center. Graphs of variables corresponding to levels of mediators and tight junction proteins are at the bottom and right. In the Graphical Output Caco-2 agents are seen as pink squares, those with intact Tight Junctions bordered in yellow (Letter A), those with failed Tight Junctions bordered in black (Letter B). This particular run is with the addition of cytomix (Letter C), seen after 12 hours of incubation (Letter D). The heterogeneous pattern of tight junction failure can be seen in the Graphical Output. Levels of Caco-2 iNOS activation can be seen in Graph Letter E, and produced Nitric Oxide (NO) can be seen in Graph Letter F. Of note, the total amount of tight junction protein occludin does decrease slightly (Graph Letter G), but the amount of occludin localized in the cell membrane drops much more rapidly (Graph Letter H), reflecting the impairment of occludin transport due to NO interference with NSF and subsequent loss of tight junction integrity.
Figure 6
Figure 6
Simulated Permeability to NO, Cytomix and Cytomix + NO scavenger. Graph of calibration data of the permeability effects of NO and Cytomix, representing the diffusion rate through a failed epithelial barrier and the effect of NO on the algorithms for epi-cell TJ protein synthesis/localization. As with Figure 4, the black bars (= Cytomix) and beige bars (= Exogenous NO) are the calibration arms. This graph can be compared with the lower panel of Figure 1 in Ref [26].
Figure 5
Figure 5
Simulated Nitrogen Oxide (NO) Production and response to NO Scavenger. Calibration data is seen in the black bars (= Cytomix) and the beige bars (= NO) with respect to simulation rules for NO production. The NO data match the levels of exogenous NO added in the experiments from [26]) in order to establish baseline responses of the epi-cell agent's TJ protein synthesis/localization algorithms and link them to the permeability data seen in the corresponding bars in Figure 5. The Cytomix bars in this Figure 4 are used to calibrate the iNOS-NO production algorithms within the epi-cell agents. The middle data set (grey bars = Cytomix + NO scavenger) show the effect of exogenous NO reduction/elimination on the generated levels of NO in the face of Cytomix. This graph can be compared to the upper panel of Figure 1 in Ref [26].
Figure 7
Figure 7
Simulated Permeability Effects of Ethyl Pyruvate and NAD+. Graph demonstrating the effects of simulated addition of ethyl pyruvate and NAD+ on the pro-inflammatory algorithms within the epi-cell agents. Both of these substances interfere with NF-kappa-B localization, and therefore are "upstream" from the iNOS-NO pathways as represented in those rules. This graph can be compared to Figure 1 from Ref [24] with ethyl pyruvate at 1.0 mM dose, and Figure 1a from Ref [25] with NAD+ at 0.1 mM dose.
Figure 8
Figure 8
Simulated Levels of ZO-1 Expression. Graph demonstrating the levels of simulated ZO-1 expression in control, exogenous NO, Cytomix, Cytomix with NO scavenger, Cytomix with ethyl pyruvate and Cytomix with NAD+ at 12 h, 24 h and 48 h. Compare with Figure 6 from Ref [24] and Figure 2 from Ref [25] (latter is extrapolated from Western blot analysis).
Figure 9
Figure 9
Simulated Level of Occludin Expression. Graph demonstrating the levels of simulated occludin expression in control, exogenous NO, Cytomix, Cytomix with NO scavenger, Cytomix with ethyl pyruvate and Cytomix with NAD+ at 12 h, 24 h and 48 h. Compare with Figure 6 from Ref [24] and Figure 2 from Ref [25] (latter is extrapolated from Western blot analysis).
Figure 10
Figure 10
Screenshots of Bilayer Gut ABM. Bilayer configuration of the gut ABM, following the structure for "hollow" organs described in the text. Figure 10a is the view of bilayer from endothelial surface. Red cubes represent endothelial cell agents, with spherical inflammatory cell agents seen just below. Inflammatory cell agents move in the plane immediately below the endothelial surface, and these interaction rules are derived from the Innate Immune response ABM from Ref. [6]. Figure 10b is the view of bilayer from epithelial surface. Pink cubes represent epithelial cell agent, governed by rules transferred from the EBABM. Impairment of TJ protein metabolism is shown by darkening of the color of the epithelial cell agent, with the epithelial cell agents eventually turning black and changing their shape to a "cone" when TJs have failed (see Figures 11, 14–16).
Figure 11
Figure 11
Gut ABM with %Isch = 35 at 4 and 18 h. Figure 11a is a graph that demonstrates the timecourses of Cellwall Occludin and Cytoplasmic Occludin over 18 hrs with an initial "%Isch" = 35. The Cellwall Occludin is shown in Red, the Cytoplasm Occludin is shown in Blue. Note that Cytoplasm Occludin has started to recover at ~12 h. The delay in recovery of the Cellwall Occludin is due to the persistent effect of NO on Occludin localization via the NSF pathway. Figure 11b is the view of gut ABM from the epithelial surface at 4 hours. Note the darkened sections of the epithelial surface, denoting impaired TJ protein metabolism and localization. The areas near the center and right upper corner of the layer show the change in shape from "cube" to "cone," indicative of TJ failure. Figure 11c is the view of gut ABM from the epithelial surface at 18 hours. Note how there has been progression to generalized TJ barrier failure, with only the small area in the left lower corner still with some intact TJs.
Figure 12
Figure 12
Timecourses for "Candidate" variables in Post-ischemic Gut Lymph. Graph of the dynamics of three potential "candidates" for the yet unidentified pro-inflammatory compound seen in post-ischemic mesenteric lymph. Note that the units of the three graphs have been adjusted to show their time-courses side-by-side; the emphasis is on the patterns of the timecourses rather than the absolute values. The "cell-damage-byproduct" graph best follows the reported characteristics of post-ischemic mesenteric lymph, with the greatest rises in pro-inflammatory activity at 3 and 6 h, and persisting to 24 h. "NO" rises early enough for the pro-inflammatory effect at 3 and 6 h, but is not present at 24 h. The "Gut-leak" is delayed in its rise, and therefore cannot account for activity seen at 3 and 6 h.
Figure 13
Figure 13
Screenshot of Multi-Bilayer Gut-Lung Axis ABM. The multiple bilayer topology of the Gut-Lung ABM is seen here. Letter A labels the pulmonary bilayer, with Aqua cubes representing pulmonary epithelial cell agents, Red cubes representing pulmonary endothelial cell agents, and below are spherical inflammatory cell agents. Letter B labels the gut bilayer, with a similar configuration, the only difference being that gut epithelial cell agents are Pink. Circulating inflammatory cell agents move between these two bilayers in the fasion described in the text.
Figure 14
Figure 14
Simulated "Pneumonia" with effect on Gut Barrier Dysfunction. This panel shows a representative run of the Gut-Lung Axis ABM with "pneumonia" as the initial perturbation. Letter A demonstrates the localized injury to the pulmonary bilayer, Letter B demonstrates areas of the gut epithelial layer that are starting to have impaired TJ protein metabolism due to gut ischemia from decreased systemic oxygenation arising from pulmonary leak.
Figure 15
Figure 15
Effect of Gut Ischemia on Pulmonary Barrier Dysfunction and Pulmonary Edema. Figure 15a shows the dynamics of pulmonary occludin levels (as a proxy for pulmonary barrier dysfunction) in a representative run with a sub-lethal initial "%Isch" = 11 over a 72 hour run. Levels of both Cytoplasm Occludin and Cellwall Occludin nadir at ~24 hrs, then show gradual recovery as inflammation subsides. TJ protein levels continue to rise towards 72 hours. This pattern is consistent with that seen clinically in the recovery of pulmonary edema secondary to inflammatory causes. Figure 15b shows a screenshot for this representative run at the end of 72 hours, demonstrating a mostly recovered pulmonary epithelial surface. Figure 15c shows the dynamics of pulmonary occludin levels in a representative run with a lethal initial "%Isch" = 13. Level of both Cytoplasm Occludin and Cellwall Occludin are seen to drop consistent with progressive activation of pulmonary endothelium and production of NO, leading to pulmonary TJ failure. This run is terminated at 24 because endothelial damage is nearly complete, as seen in the corresponding screenshot in Figure 15d. Figure 15d Letter A points to black cubes representing "dead" endothelial cell agents. These agents "die" owing to a decrease in the available maximal "oxy" level to below the threshold for generalized endothelial agent activation. The impaired systemic oxygenation due to pulmonary leak arises from pulmonary epithelial barrier failure. Letter B points to the only remaining intact pulmonary epithelial cell agents. Letter C points to the only remaining intact gut epithelial cell agents. Letter D points to the only remaining patches of surviving endothelial agents (red areas seen through the failed gut barrier).
Figure 16
Figure 16
Effect of Simulated Supplementary Oxygen on dynamics of simulated Pneumonia. Figure 16a demonstrates the dynamics of pulmonary Cytoplasm and Cellwall occludin in a representative run with an initial "%Isch" = 15, and the addition of simulated organ support in the form of "Supplementary Oxygen" at 50%. The effect of "Supplementary Oxygen" is additive to the level of "oxy" generated by the lung ABM and distributed to the endothelial surface. The initial drop of the pulmonary Occludins is consistent with inflammatory effects of post-ischemic mesenteric lymph. The effect of the "Supplementary Oxygen" is to blunt the effect of the resulting pulmonary edema, and it keeps the "oxy" level above the threshold ischemic level for activation of the generalized endothelial cell agent population. As a result the endothelial surface if maintained through the period of most intense inflammation, and allows the epithelial cells to begin recovery of their TJs (see Letter A in Figure 16a). The stabilization and initiation of recovery of pulmonary epithelial TJs at 72 hours is consistent with the clinical time course of adult respiratory distress syndrome due to an episode of shock. Figure 16b is a concurrent screenshot of the representative run. Letter A demonstrates the intact endothelial agent layer due to "Supplementary Oxygen" support (compare with Figure 15c, Letter A). Letter B demonstrates the recovering pulmonary epithelial cell agents. Letter C demonstrates intact and recovering gut epithelial.

Similar articles

Cited by

References

    1. An G. Concepts for developing a collaborative in silico model of the acute inflammatory response using agent-based modeling. Journal of critical care. 2006;21:105–110. doi: 10.1016/j.jcrc.2005.11.012. discussion 110-101. - DOI - PubMed
    1. Zhang L, Athale CA, Deisboeck TS. Development of a three-dimensional multiscale agent-based tumor model: simulating gene-protein interaction profiles, cell phenotypes and multicellular patterns in brain cancer. Journal of theoretical biology. 2007;244:96–107. doi: 10.1016/j.jtbi.2006.06.034. - DOI - PubMed
    1. Bonabeau E. Agent-based modeling: methods and techniques for simulating human systems. Proceedings of the National Academy of Sciences of the United States of America. 2002;99:7280–7287. doi: 10.1073/pnas.082080899. - DOI - PMC - PubMed
    1. Bankes SC. Agent-based modeling: a revolution? Proceedings of the National Academy of Sciences of the United States of America. 2002;99:7199–7200. doi: 10.1073/pnas.072081299. - DOI - PMC - PubMed
    1. An G. Agent-based computer simulation and sirs: building a bridge between basic science and clinical trials. Shock. 2001;16:266–273. - PubMed

Publication types