

P2X1 and P2X5 subunits form the functional P2X receptor in mouse cortical astrocytes
- PMID: 18495881
- PMCID: PMC3844808
- DOI: 10.1523/JNEUROSCI.1149-08.2008
P2X1 and P2X5 subunits form the functional P2X receptor in mouse cortical astrocytes
Abstract
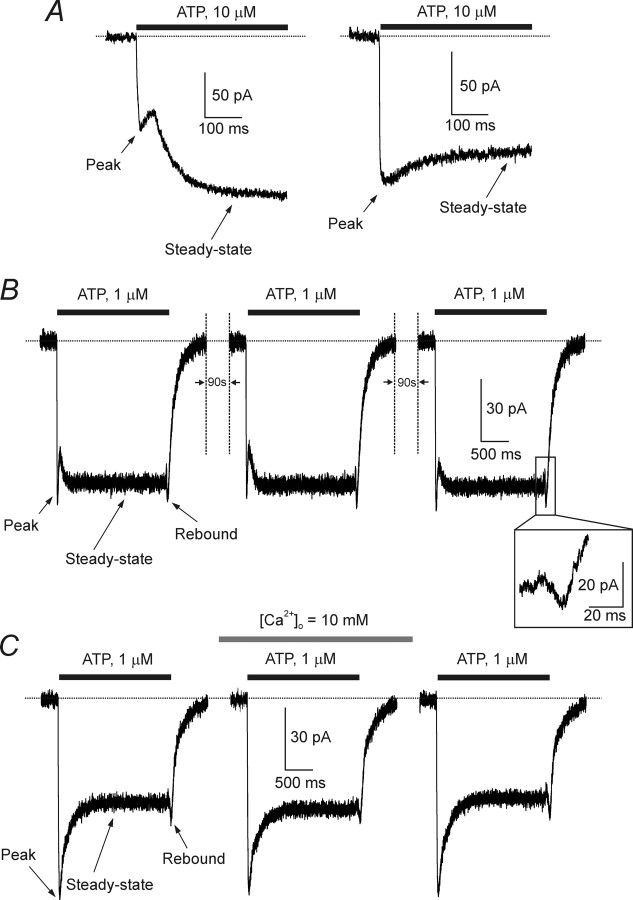
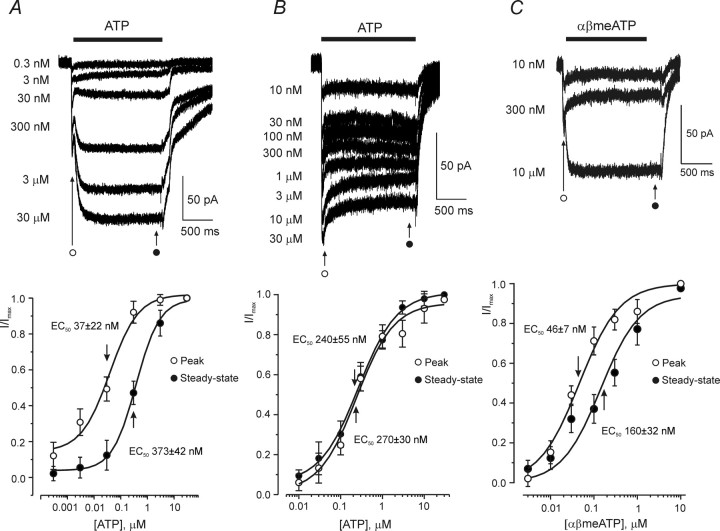
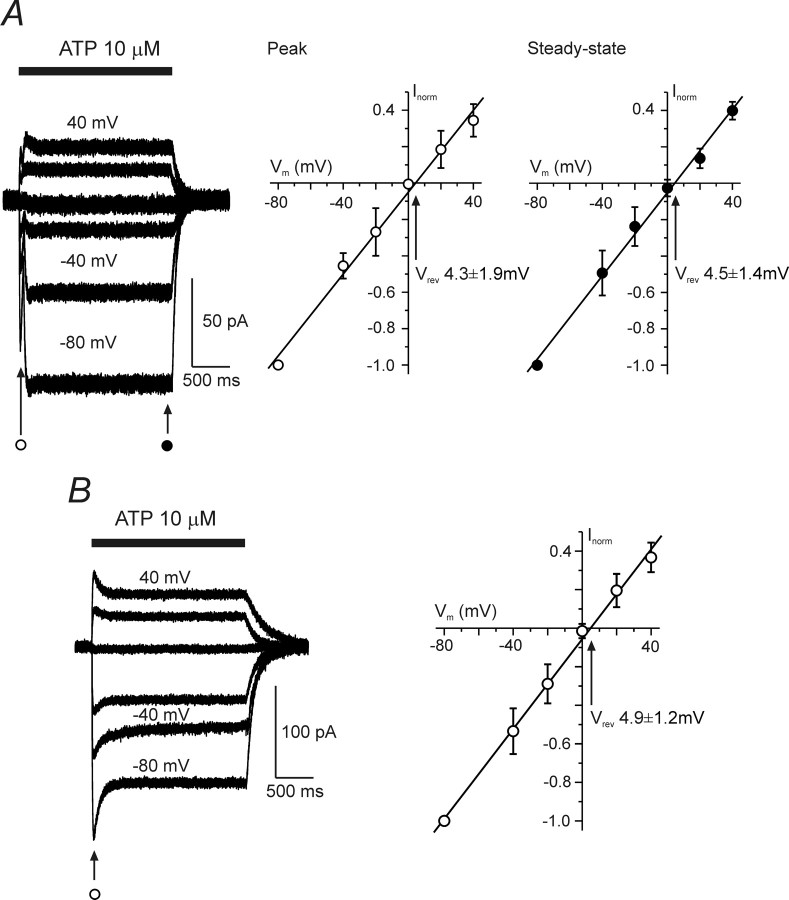
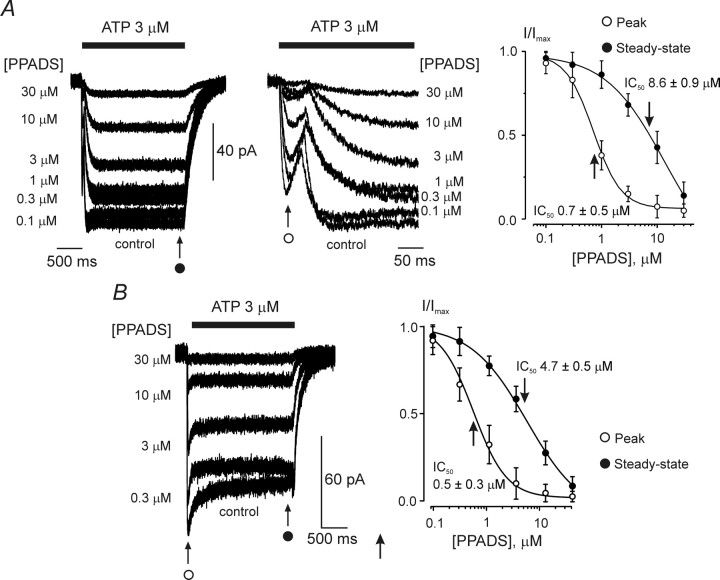
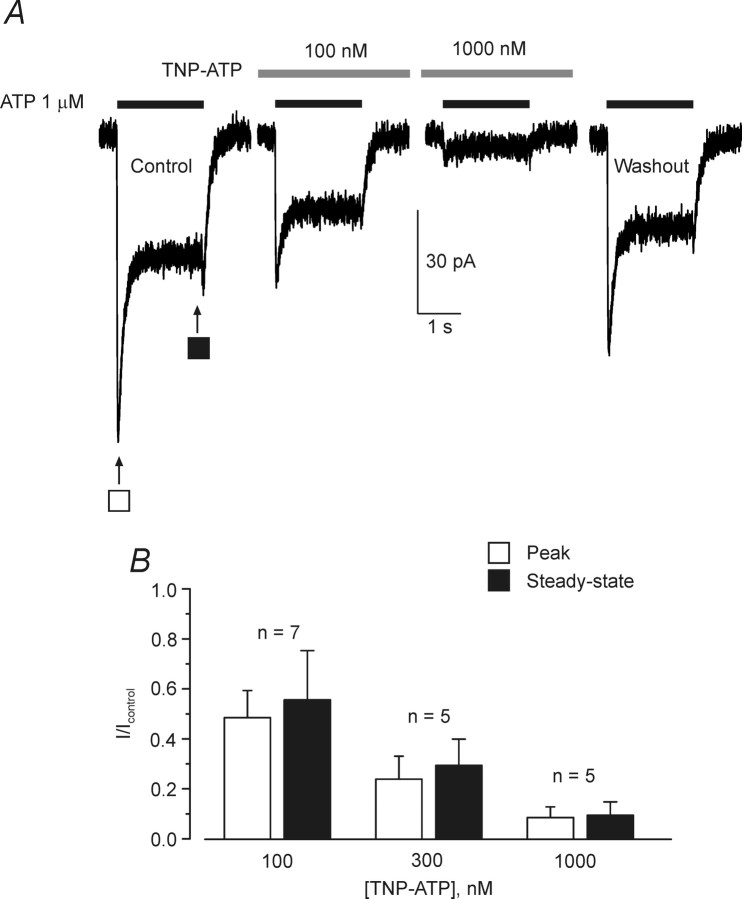
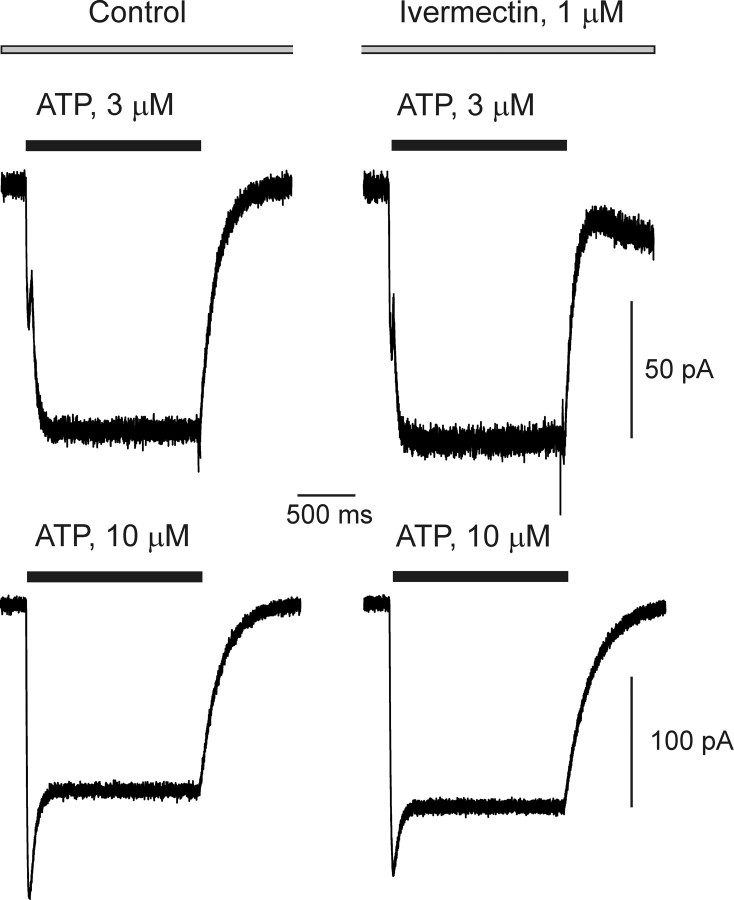
ATP plays an important role in signal transduction between neuronal and glial circuits and within glial networks. Here we describe currents activated by ATP in astrocytes acutely isolated from cortical brain slices by non-enzymatic mechanical dissociation. Brain slices were prepared from transgenic mice that express enhanced green fluorescent protein under the control of the human glial fibrillary acidic protein promoter. Astrocytes were studied by whole-cell voltage clamp. Exogenous ATP evoked inward currents in 75 of 81 astrocytes. In the majority ( approximately 65%) of cells, ATP-induced responses comprising a fast and delayed component; in the remaining subpopulation of astrocytes, ATP triggered a smoother response with rapid peak and slowly decaying plateau phase. The fast component of the response was sensitive to low concentrations of ATP (with EC(50) of approximately 40 nm). All ATP-induced currents were blocked by pyridoxal-phosphate-6-azophenyl-2',4'-disulfonate (PPADS); they were insensitive to ivermectin. Quantitative real-time PCR demonstrated strong expression of P2X(1) and P2X(5) receptor subunits and some expression of P2X(2) subunit mRNAs. The main properties of the ATP-induced response in cortical astrocytes (high sensitivity to ATP, biphasic kinetics, and sensitivity to PPADS) were very similar to those reported for P2X(1/5) heteromeric receptors studied previously in heterologous expression systems.
Figures

Similar articles
-
Modulation of heteromeric P2X1/5 receptors by phosphoinositides in astrocytes depends on the P2X1 subunit.J Neurochem. 2010 Jun;113(6):1676-84. doi: 10.1111/j.1471-4159.2010.06734.x. Epub 2010 Apr 3. J Neurochem. 2010. PMID: 20374427
-
Characterization of cultured dorsal root ganglion neuron P2X receptors.Eur J Neurosci. 1999 Jan;11(1):149-54. doi: 10.1046/j.1460-9568.1999.00426.x. Eur J Neurosci. 1999. PMID: 9987019
-
Lack of run-down of smooth muscle P2X receptor currents recorded with the amphotericin permeabilized patch technique, physiological and pharmacological characterization of the properties of mesenteric artery P2X receptor ion channels.Br J Pharmacol. 2000 Dec;131(8):1659-66. doi: 10.1038/sj.bjp.0703744. Br J Pharmacol. 2000. PMID: 11139444 Free PMC article.
-
Rehabilitation of the P2X5 receptor: a re-evaluation of structure and function.Purinergic Signal. 2023 Jun;19(2):421-439. doi: 10.1007/s11302-022-09903-0. Epub 2022 Oct 24. Purinergic Signal. 2023. PMID: 36279087 Free PMC article. Review.
-
Dynamic aspects of functional regulation of the ATP receptor channel P2X2.J Physiol. 2009 Nov 15;587(Pt 22):5317-24. doi: 10.1113/jphysiol.2009.179309. Epub 2009 Sep 14. J Physiol. 2009. PMID: 19752115 Free PMC article. Review.
Cited by
-
The computational power of astrocyte mediated synaptic plasticity.Front Comput Neurosci. 2012 Nov 1;6:93. doi: 10.3389/fncom.2012.00093. eCollection 2012. Front Comput Neurosci. 2012. PMID: 23125832 Free PMC article.
-
Astrocytes mediate neurovascular signaling to capillary pericytes but not to arterioles.Nat Neurosci. 2016 Dec;19(12):1619-1627. doi: 10.1038/nn.4428. Epub 2016 Oct 24. Nat Neurosci. 2016. PMID: 27775719 Free PMC article.
-
Molecular and functional properties of P2X receptors--recent progress and persisting challenges.Purinergic Signal. 2012 Sep;8(3):375-417. doi: 10.1007/s11302-012-9314-7. Epub 2012 May 1. Purinergic Signal. 2012. PMID: 22547202 Free PMC article. Review.
-
The P2X1 receptor and platelet function.Purinergic Signal. 2011 Sep;7(3):341-56. doi: 10.1007/s11302-011-9224-0. Epub 2011 Mar 22. Purinergic Signal. 2011. PMID: 21484087 Free PMC article.
-
Physiology of Astroglia.Physiol Rev. 2018 Jan 1;98(1):239-389. doi: 10.1152/physrev.00042.2016. Physiol Rev. 2018. PMID: 29351512 Free PMC article. Review.
References
-
- Andersen CL, Jensen JL, Orntoft TF. Normalization of real-time quantitative reverse transcription-PCR data: a model-based variance estimation approach to identify genes suited for normalization, applied to bladder and colon cancer data sets. Cancer Res. 2004;64:5245–5250. - PubMed
-
- Ashour F, Deuchars J. Electron microscopic localisation of P2X4 receptor subunit immunoreactivity to pre- and post-synaptic neuronal elements and glial processes in the dorsal vagal complex of the rat. Brain Res. 2004;1026:44–55. - PubMed
-
- Barrera NP, Ormond SJ, Henderson RM, Murrell-Lagnado RD, Edwardson JM. Atomic force microscopy imaging demonstrates that P2X2 receptors are trimers but that P2X6 receptor subunits do not oligomerize. J Biol Chem. 2005;280:10759–10765. - PubMed
-
- Burnstock G. Purinergic nerves. Pharmacol Rev. 1972;24:509–581. - PubMed
Publication types
MeSH terms
Substances
Grants and funding
LinkOut - more resources
Full Text Sources
Molecular Biology Databases
