. 2008 May 21;28(21):5422-32.
doi: 10.1523/JNEUROSCI.0955-08.2008.

Response of a neuronal model of tuberous sclerosis to mammalian target of rapamycin (mTOR) inhibitors: effects on mTORC1 and Akt signaling lead to improved survival and function

Affiliations

Response of a neuronal model of tuberous sclerosis to mammalian target of rapamycin (mTOR) inhibitors: effects on mTORC1 and Akt signaling lead to improved survival and function

Lynsey Meikle et al. J Neurosci. .

Abstract

Tuberous sclerosis (TSC) is a hamartoma syndrome attributable to mutations in either TSC1 or TSC2 in which brain involvement causes epilepsy, mental retardation, and autism. We have reported recently (Meikle et al., 2007) a mouse neuronal model of TSC in which Tsc1 is ablated in most neurons during cortical development. We have tested rapamycin and RAD001 [40-O-(2-hydroxyethyl)-rapamycin], both mammalian target of rapamycin mTORC1 inhibitors, as potential therapeutic agents in this model. Median survival is improved from 33 d to more than 100 d; behavior, phenotype, and weight gain are all also markedly improved. There is brain penetration of both drugs, with accumulation over time with repetitive treatment, and effective reduction of levels of phospho-S6, a downstream target of mTORC1. In addition, there is restoration of phospho-Akt and phospho-glycogen synthase kinase 3 levels in the treated mice, consistent with restoration of Akt function. Neurofilament abnormalities, myelination, and cell enlargement are all improved by the treatment. However, dysplastic neuronal features persist, and there are only modest changes in dendritic spine density and length. Strikingly, mice treated with rapamycin or RAD001 for 23 d only (postnatal days 7-30) displayed a persistent improvement in phenotype, with median survival of 78 d. In summary, rapamycin/RAD001 are highly effective therapies for this neuronal model of TSC, with benefit apparently attributable to effects on mTORC1 and Akt signaling and, consequently, cell size and myelination. Although caution is appropriate, the results suggest the possibility that rapamycin/RAD001 may have benefit in the treatment of TSC brain disease, including infantile spasms.


Figures

Figure 1.
Figure 1.
Pharmacokinetics, survival benefit, and brain signaling effects of rapamycin and RAD001 in Tsc1null-neuron mice. A–F, Pharmacokinetic analyses of rapamycin (A–C) and RAD001 (D–F) in P30–P45 mice. Both drugs were given at 6 mg/kg intraperitoneally. SEMs are indicated. n = 3 for all rapamycin measurements; n = 3 for all but 5 RAD001 measurements. A, D, Drug levels in plasma, brain, and liver. Time after a single intraperitoneal injection is shown on the x-axis. Note that y-axis is exponential. B, E, Drug levels at 24 and 48 h after single and multiple doses. Multiple doses were given every other day. C, F, Drug levels in older (P30–P45) mice compared with young (P10) mice 24 h after a single intraperitoneal dose. G, H, Survival curves of Tsc1null-neuron mice treated with rapamycin (G) or RAD001 (H). Doses of each drug, periods of treatment, and numbers of treated mice are indicated. Treatment began at P7–P9 for all mice. Note that dashed lines reflect a cohort of mice in which treatment was discontinued after P30. Tsc1c SynICre+ mice comprised 58, 78, and 61% of the rapamycin, RAD001, and untreated cohorts, respectively. The remainder were Tsc1cc SynICre+. Note that the survival of untreated Tsc1c SynICre+ and Tsc1cc SynICre+ mice were not different, with medians of 32 and 34 d, respectively (not shown). I, Immunoblot analysis of P30 brain lysates collected 24 h after the last dose of drug shows reduction of Tsc1 protein levels (*) in all Tsc1null-neuron (mutant) brain lysates and reduction in pS6(240/4) and pS6(235/6) in lysates from treated mutant mice. AKT and ERK2 are loading controls. Mut, Mutant; Cont, controls. Both rapamycin (RAP) and RAD001 were given 6 mg/kg intraperitoneally every other day, beginning at P7–P9. Lanes 1, 2, 6, 8, and 9 were Tsc1c SynICre+; lanes 5, 7, and 10 were Tsc1cc SynICre+; lanes 3 and 4 were Tsc1c+ SynICre.
Figure 2.
Figure 2.
Clinical and histological improvement in Tsc1null-neuron mice treated with rapamycin. A–D, Pictures of mice. Control and mutant (Tsc1null-neuron) mice with or without rapamycin treatment are shown. Rapamycin was given 6 mg/kg intraperitoneally every other day from P7 to P9 and was discontinued at P30 in the on/off mouse. A, C, D are all P45; B is P30. Note abnormal posture of mutant and mutant on/off treatment mice. E–I, Combined NeuN (red)–pS6(S235/236) (green) stains of base of cortex over the anterior hippocampus. P45 control, P30 mutant (Tsc1null-neuron), P45 rapamycin-treated mutant, P45 rapamycin-treated mutant until P30 then taken off drug (on/off), and P45 rapamycin-treated control mouse sections are shown. Scale bar, 50 μm. Images were collected using the confocal microscope on a single slice at 200× with 0.7 zoom. J–L, Hematoxylin and eosin stains of the cortex demonstrate mild cortical disorganization in the mutant mouse with global cell enlargement particularly at the base of cortex (*), with improvement with treatment. Ages and treatments are as in E–G. Genotypes for mice were as follows: A, E, I, J, Tsc1c+ SynICre+; F, L, Tsc1c SynICre+; B, C, D, G, H, K, Tsc1cc SynICre+. M, Brain weight to body weight ratio in these same groups of mice, all at P30. Each point is a different mouse; the line indicates the mean. p < 0.01 for each group compared with untreated mutant. Numbers and genotypes of mice were as follows: Mutant, six Tsc1c SynICre+; Control, three Tsc1c+ SynICre+; Mutant + Rap, three Tsc1cc SynICre+, three Tsc1c SynICre+; Control + Rap, two Tsc1c+ SynICre+.
Figure 3.
Figure 3.
Effects on neuronal size and orientation in Tsc1null-neuron mice of treatment with rapamycin. A–J, Paired images are shown for P45 control, P30 mutant (Tsc1null-neuron), P45 rapamycin-treated mutant, and P45 rapamycin-treated until P30 then taken off drug (on/off) mutant, and P45 rapamycin-treated control, respectively. Scale bar, 50 μm. All images are Z-stacked 200× confocal images. Genotypes of mice were as follows: A, E, F, J, Tsc1c+ SynICre+; B, G, K, Tsc1c SynICre+; C, D, H, I, L, Tsc1cc SynICre+. A–E, Nonphosphorylated neurofilament (SMI311) expression (red) and 4′,6′-diamidino-2-phenylindole (DAPI) (blue). F–J, Nonphosphorylated neurofilament (SMI311) expression (red) with pS6(S235/236) expression (green) and DAPI (blue) stains of lateral cortex. Note abnormal SMI311+ cells that are enlarged and dysplastic in the untreated mutant mice. These cells have reduced cell size but not degree of dysplasia in response to rapamycin. In mice taken off rapamycin, there is recurrence of cell enlargement. K, L, Higher-power view of cells from images G and H highlight the aberrant polarity of the apical dendrite of these neurons, despite the smaller size of the treated mutant neuron (L). Scale bar, 10 μm. Both images are Z-stacked 630×, 1.5× zoom confocal images. M, Cell size measurements in these same five categories of mice, from SMI311-stained lateral cortex. Cell size is indicated in square micrometers. Each point is the size of one SMI311-stained neuron, with eight neurons counted per mouse section. The average size and SEM are shown. Comparisons between each of the mutant and the on/off mutant and each of the control, treated mutant, and treated control are significant at p = 0.02 to <0.0001. All other comparisons have p > 0.05. Numbers and genotypes of mice were as follows: Mutant, four Tsc1c SynICre+; Control, four Tsc1c+ SynICre+; Mutant + Rap, three Tsc1cc SynICre+; Mutant + Rap on/off, two Tsc1cc SynICre+; Control + Rap, two Tsc1c+ SynICre+. N, Cortical section indicates region of cortex and orientation shown in A–J.
Figure 4.
Figure 4.
Improvement in myelination in Tsc1null-neuron mice treated with rapamycin. Each of the five columns of figures is taken from P45 control, P30 mutant (Tsc1null-neuron), P45 rapamycin-treated mutant, and P45 rapamycin-treated until P30 then taken off drug (on/off) mutant, and P45 rapamycin-treated control, respectively. A–E, Myelin stain of the retrosplenial granular region of cortex demonstrates that there is a marked reduction in myelination in untreated Tsc1null-neuron mice, which improves with treatment, and that myelination in the on/off mice also begins to look somewhat more patchy than in other groups. Scale bar, 100 μm. All images captured on Nikon fluorescence microscope at 60× and constant exposure. F–J, Myelin stain of the CA3 region of anterior hippocampus shows similar findings to those in cortex. Scale bar, 100 μm. All images captured on Nikon fluorescence microscope at constant exposure. K–O, Combined myelin (red)–pS6(S235/236) (green) stain of CA3 region of hippocampus demonstrates that there are enlarged pS6+ cells with reduced myelin in this region in untreated mutant mice, both of which improve with rapamycin treatment. pS6 expression and cell enlargement recur in the on/off treated mutant mice. Scale bar, 20 μm. All images are Z-stacked 630× confocal images. Genotypes of mice were as follows: A, E, F, J, K, O, Tsc1c+ SynICre+; B, G, L, Tsc1c SynICre+; C, D, H, I, M, N, Tsc1cc SynICre+.
Figure 5.
Figure 5.
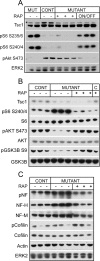
Signaling and cytoskeletal effects of rapamycin treatment in Tsc1null-neuron mice. A, Immunoblot analysis of brain lysates from P30 mutant (Tsc1null-neuron), P60 control, P60 rapamycin-treated mutant, and P60 rapamycin-treated until P30 then taken off drug (on/off). Note that treatment-induced changes in both pS6 levels and in pAkt S473 levels reverse when treatment is discontinued. * denotes Tsc1 protein band. All mutants were Tsc1c SynICre+; both controls were Tsc1c+ SynICre+. B, C, Immunoblot analysis of brain lysates from P30 control, P30 mutant (Tsc1null-neuron), and P30 rapamycin-treated mutant and control (B) mice are shown. B, Note reduction in elevated pS6(S240/244) levels as well as an increase in reduced pS473–AKT and pS9–GSK3B levels of the mutant mice with treatment. C, In addition, abnormal increases in phosphorylated neurofilament (pNF) and neurofilament heavy (NF-H) and medium (NF-M) chains are reduced in response to rapamycin. Note that pCofilin(S3) levels are not consistently different among mutant and control mice. The untreated and treated controls were all Tsc1c+ SynICre+; untreated mutants were all Tsc1cc SynICre+; treated mutants were one Tsc1cc SynICre+ and two Tsc1c SynICre+.
Figure 6.
Figure 6.
Dendritic spines in Tsc1null-neuron brains and response to rapamycin. A–E, Confocal images of DiI-stained P23–P30 brain sections are shown. All are Z-stacked. A, C, and D were Tsc1cc SynICre+; B and E were Tsc1c+ SynICre+. A, Representative pyramidal neuron with apical dendrite. Scale bar, 10 μm. 200× confocal image with 1.5 zoom. B–E, Dendrite segments from control, mutant (Tsc1null-neuron), rapamycin-treated mutant, and rapamycin-treated control mice. Scale bar, 2 μm. 630× confocal images with 1.5 zoom.

Comment in

Similar articles

Cited by

References

    1. Au KS, Williams AT, Roach ES, Batchelor L, Sparagana SP, Delgado MR, Wheless JW, Baumgartner JE, Roa BB, Wilson CM, Smith-Knuppel TK, Cheung MY, Whittemore VH, King TM, Northrup H. Genotype/phenotype correlation in 325 individuals referred for a diagnosis of tuberous sclerosis complex in the United States. Genet Med. 2007;9:88–100. - PubMed
    1. Avruch J, Hara K, Lin Y, Liu M, Long X, Ortiz-Vega S, Yonezawa K. Insulin and amino-acid regulation of mTOR signaling and kinase activity through the Rheb GTPase. Oncogene. 2006;25:6361–6372. - PubMed
    1. Baybis M, Yu J, Lee A, Golden JA, Weiner H, McKhann G, II, Aronica E, Crino PB. mTOR cascade activation distinguishes tubers from focal cortical dysplasia. Ann Neurol. 2004;56:478–487. - PubMed
    1. Bilanges B, Argonza-Barrett R, Kolesnichenko M, Skinner C, Nair M, Chen M, Stokoe D. Tuberous sclerosis complex proteins 1 and 2 control serum-dependent translation in a TOP-dependent and -independent manner. Mol Cell Biol. 2007;27:5746–5764. - PMC - PubMed
    1. Brown EJ, Albers MW, Shin TB, Ichikawa K, Keith CT, Lane WS, Schreiber SL. A mammalian protein targeted by G1-arresting rapamycin-receptor complex. Nature. 1994;369:756–758. - PubMed

Publication types

MeSH terms