

Arsenite-induced mitotic death involves stress response and is independent of tubulin polymerization
- PMID: 18485433
- PMCID: PMC2504415
- DOI: 10.1016/j.taap.2008.02.030
Arsenite-induced mitotic death involves stress response and is independent of tubulin polymerization
Abstract
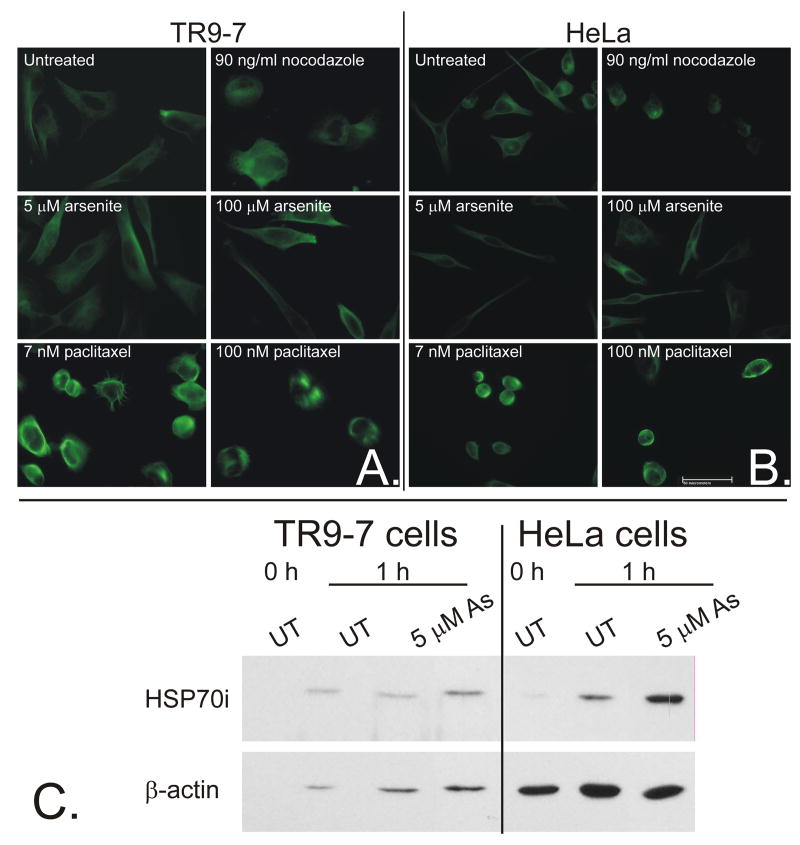
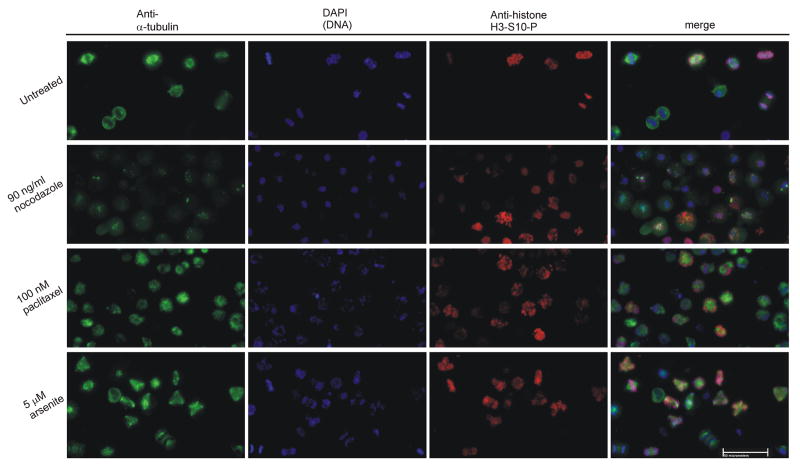
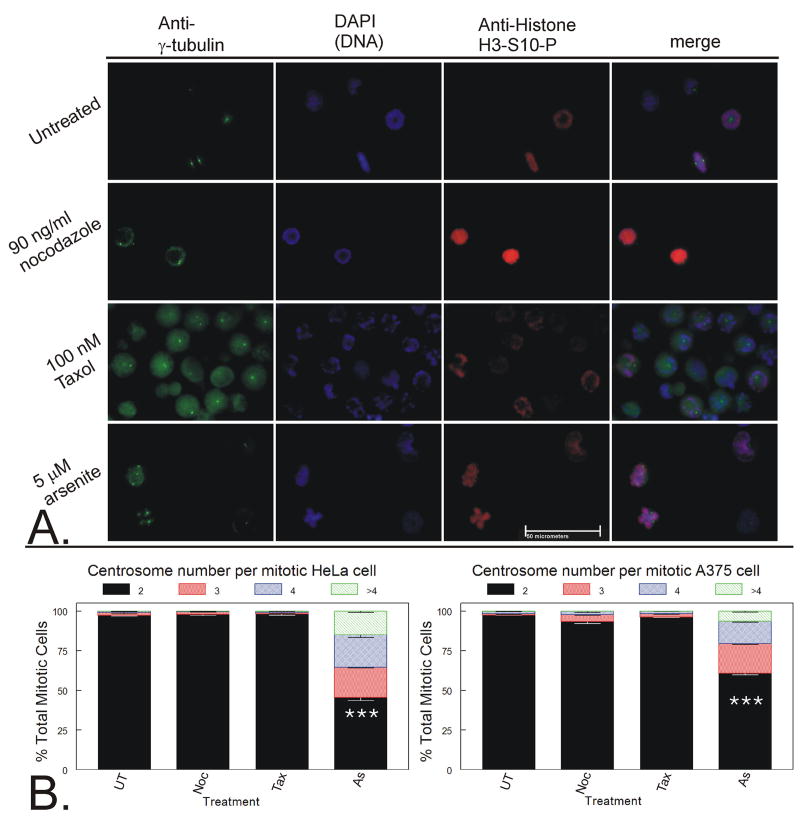
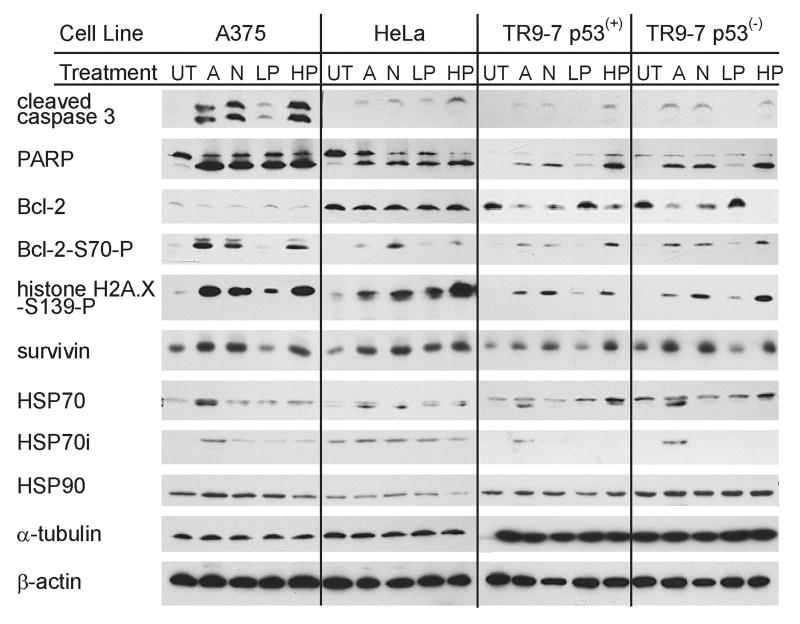
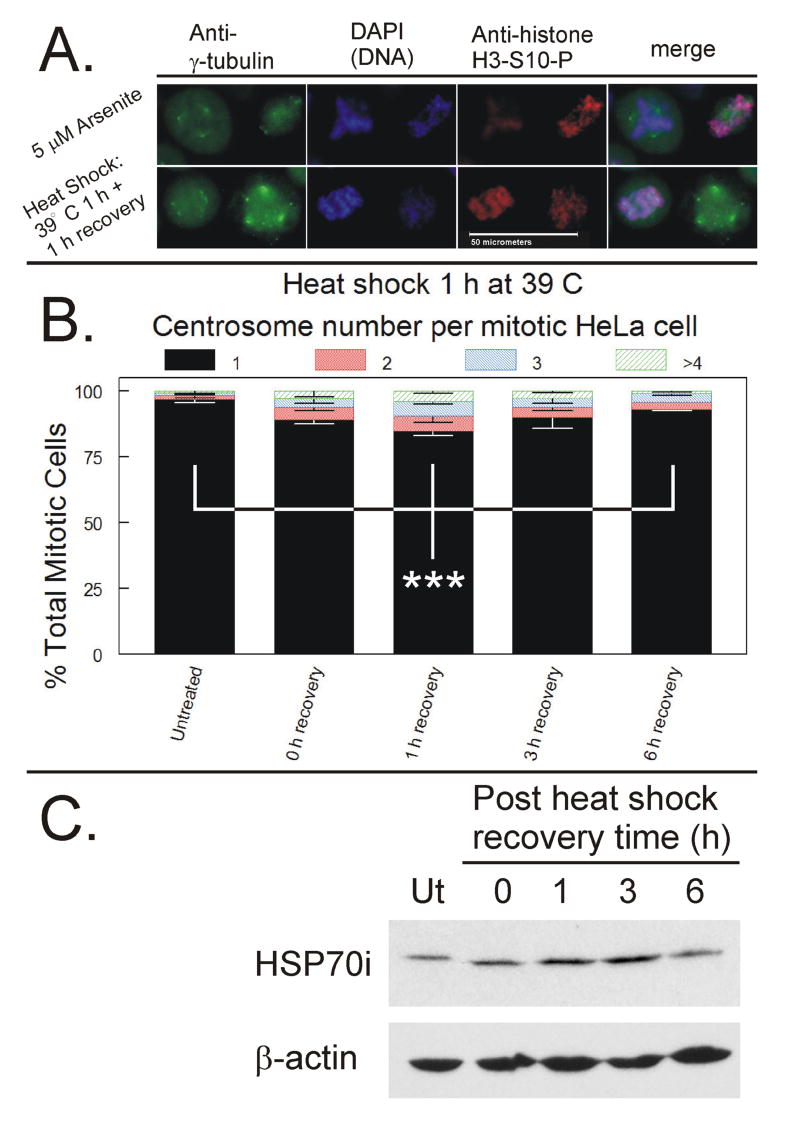
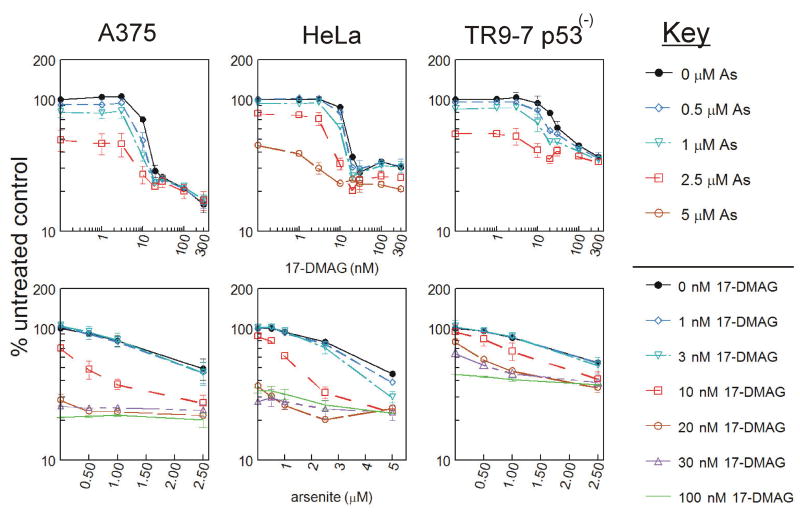
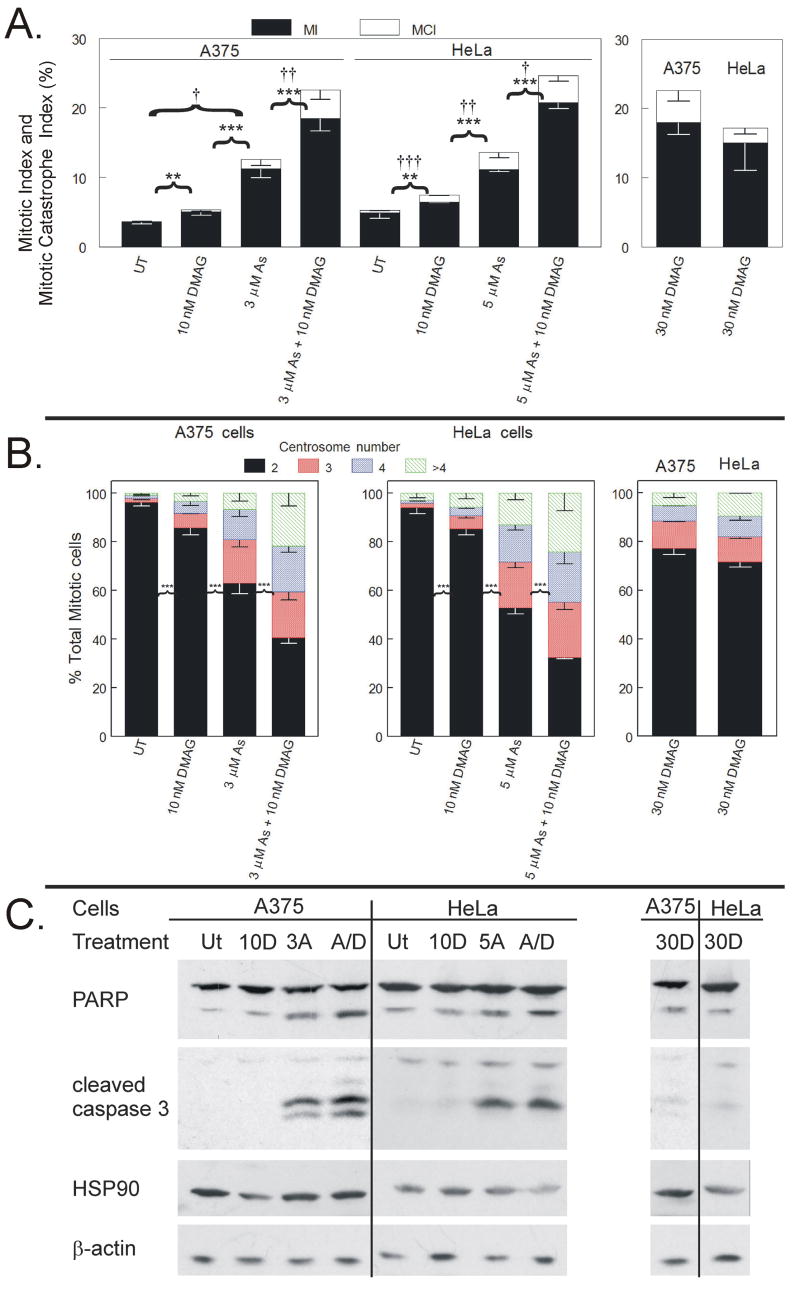
Arsenite, a known mitotic disruptor, causes cell cycle arrest and cell death at anaphase. The mechanism causing mitotic arrest is highly disputed. We compared arsenite to the spindle poisons nocodazole and paclitaxel. Immunofluorescence analysis of alpha-tubulin in interphase cells demonstrated that, while nocodazole and paclitaxel disrupt microtubule polymerization through destabilization and hyperpolymerization, respectively, microtubules in arsenite-treated cells remain comparable to untreated cells even at supra-therapeutic concentrations. Immunofluorescence analysis of alpha-tubulin in mitotic cells showed spindle formation in arsenite- and paclitaxel-treated cells but not in nocodazole-treated cells. Spindle formation in arsenite-treated cells appeared irregular and multi-polar. gamma-tubulin staining showed that cells treated with nocodazole and therapeutic concentrations of paclitaxel contained two centrosomes. In contrast, most arsenite-treated mitotic cells contained more than two centrosomes, similar to centrosome abnormalities induced by heat shock. Of the three drugs tested, only arsenite treatment increased expression of the inducible isoform of heat shock protein 70 (HSP70i). HSP70 and HSP90 proteins are intimately involved in centrosome regulation and mitotic spindle formation. HSP90 inhibitor 17-DMAG sensitized cells to arsenite treatment and increased arsenite-induced centrosome abnormalities. Combined treatment of 17-DMAG and arsenite resulted in a supra-additive effect on viability, mitotic arrest, and centrosome abnormalities. Thus, arsenite-induced abnormal centrosome amplification and subsequent mitotic arrest is independent of effects on tubulin polymerization and may be due to specific stresses that are protected against by HSP90 and HSP70.
Figures
Similar articles
-
Induction of C-anaphase and diplochromosome through dysregulation of spindle assembly checkpoint by sodium arsenite in human fibroblasts.Cancer Res. 2003 Oct 15;63(20):6680-8. Cancer Res. 2003. PMID: 14583462
-
Induction of centrosome amplification during arsenite-induced mitotic arrest in CGL-2 cells.Cancer Res. 2006 Feb 15;66(4):2098-106. doi: 10.1158/0008-5472.CAN-05-2308. Cancer Res. 2006. PMID: 16489010
-
Nakiterpiosin targets tubulin and triggers mitotic catastrophe in human cancer cells.Mol Cancer Ther. 2010 Dec;9(12):3375-85. doi: 10.1158/1535-7163.MCT-10-0305. Epub 2010 Dec 7. Mol Cancer Ther. 2010. PMID: 21139045 Free PMC article.
-
Taxanes: microtubule and centrosome targets, and cell cycle dependent mechanisms of action.Curr Cancer Drug Targets. 2003 Jun;3(3):193-203. doi: 10.2174/1568009033481967. Curr Cancer Drug Targets. 2003. PMID: 12769688 Review.
-
The role of nucleation in patterning microtubule networks.J Cell Sci. 1998 Aug;111 ( Pt 15):2077-83. doi: 10.1242/jcs.111.15.2077. J Cell Sci. 1998. PMID: 9664029 Review.
Cited by
-
The Development and Clinical Applications of Oral Arsenic Trioxide for Acute Promyelocytic Leukaemia and Other Diseases.Pharmaceutics. 2022 Sep 14;14(9):1945. doi: 10.3390/pharmaceutics14091945. Pharmaceutics. 2022. PMID: 36145693 Free PMC article. Review.
-
Mechanisms of genotoxicity and proteotoxicity induced by the metalloids arsenic and antimony.Cell Mol Life Sci. 2023 Oct 30;80(11):342. doi: 10.1007/s00018-023-04992-5. Cell Mol Life Sci. 2023. PMID: 37904059 Free PMC article. Review.
-
Cisplatin plus sodium arsenite and hyperthermia induces pseudo-G1 associated apoptotic cell death in ovarian cancer cells.Toxicol Sci. 2014 May;139(1):74-82. doi: 10.1093/toxsci/kfu029. Epub 2014 Feb 11. Toxicol Sci. 2014. PMID: 24519527 Free PMC article.
-
Disruption of Mitotic Progression by Arsenic.Biol Trace Elem Res. 2015 Jul;166(1):34-40. doi: 10.1007/s12011-015-0306-7. Epub 2015 Mar 22. Biol Trace Elem Res. 2015. PMID: 25796515 Free PMC article. Review.
-
Genetic basis of arsenite and cadmium tolerance in Saccharomyces cerevisiae.BMC Genomics. 2009 Mar 12;10:105. doi: 10.1186/1471-2164-10-105. BMC Genomics. 2009. PMID: 19284616 Free PMC article.
References
-
- Abal M, Andreu JM, Barasoain I. Taxanes: microtubule and centrosome targets, and cell cycle dependent mechanisms of action. Curr Cancer Drug Targets. 2003;3:193–203. - PubMed
-
- Amadori S, Fenaux P, Ludwig H, O'dwyer M, Sanz M. Use of arsenic trioxide in haematological malignancies: insight into the clinical development of a novel agent. Curr Med Res Opin. 2005;21:403–411. - PubMed
-
- Antman KH. Introduction: the history of arsenic trioxide in cancer therapy. Oncologist. 2001;6 2:1–2. - PubMed
-
- Barnes JA, Collins BW, Dix DJ, Allen JW. Effects of heat shock protein 70 (Hsp70) on arsenite-induced genotoxicity. Environ Mol Mutagen. 2002;40:236–242. - PubMed
Publication types
MeSH terms
Substances
Grants and funding
LinkOut - more resources
Full Text Sources
Other Literature Sources
