. 2008 Jul;82(14):6838-51.
doi: 10.1128/JVI.00697-08. Epub 2008 May 14.

In vitro-generated antigen-specific CD4+ CD25+ Foxp3+ regulatory T cells control the severity of herpes simplex virus-induced ocular immunoinflammatory lesions

Affiliations

In vitro-generated antigen-specific CD4+ CD25+ Foxp3+ regulatory T cells control the severity of herpes simplex virus-induced ocular immunoinflammatory lesions

Sharvan Sehrawat et al. J Virol. 2008 Jul.

Abstract

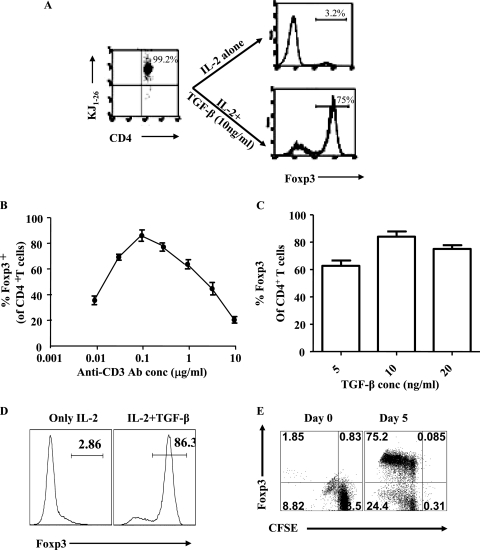
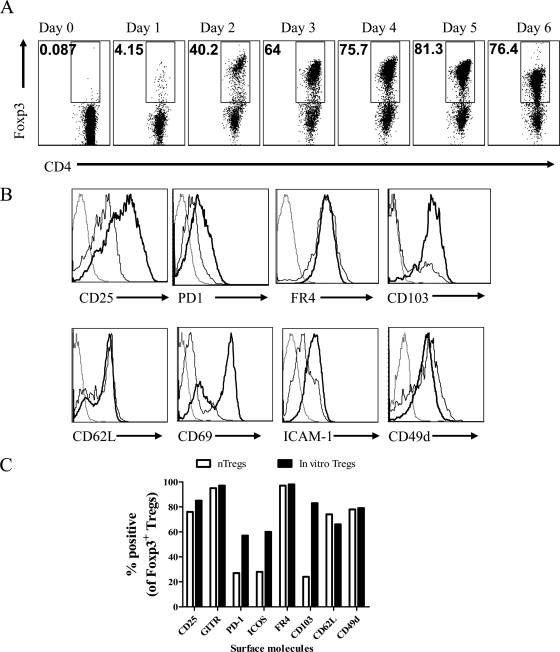
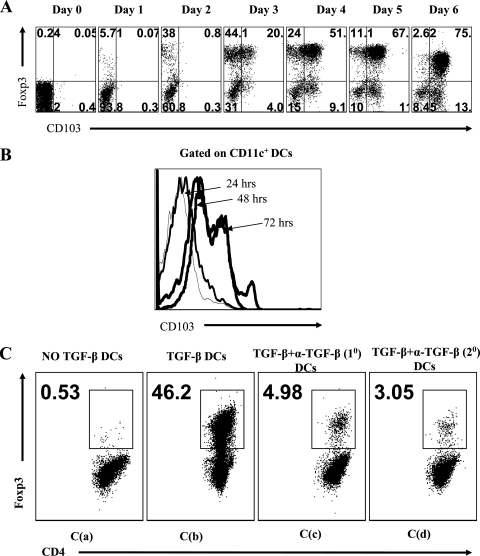
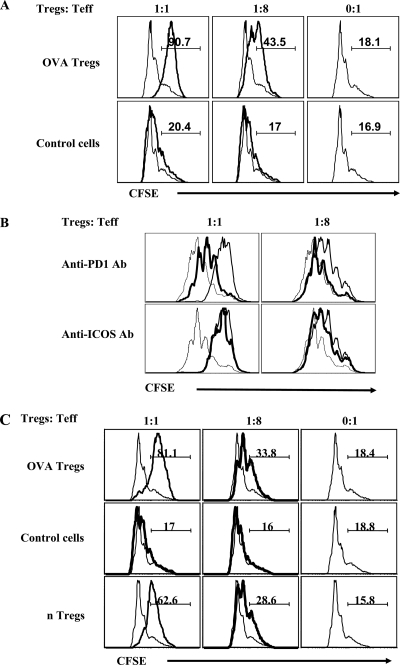
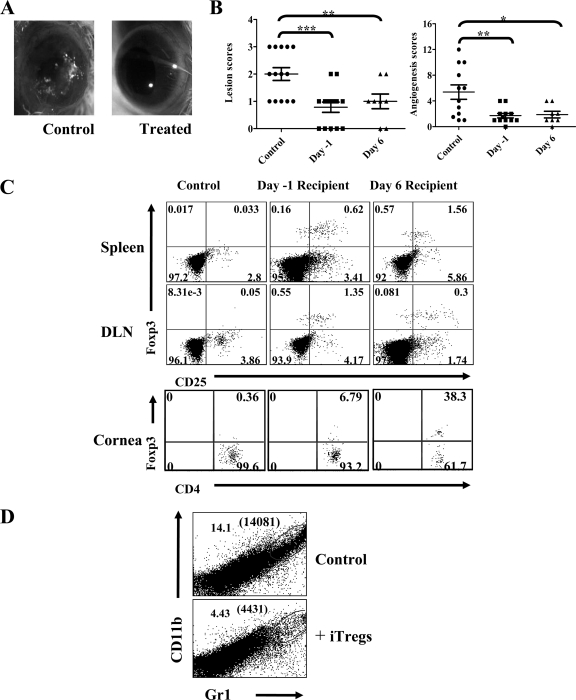
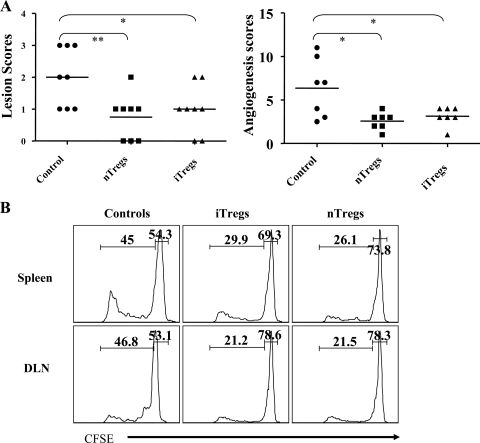
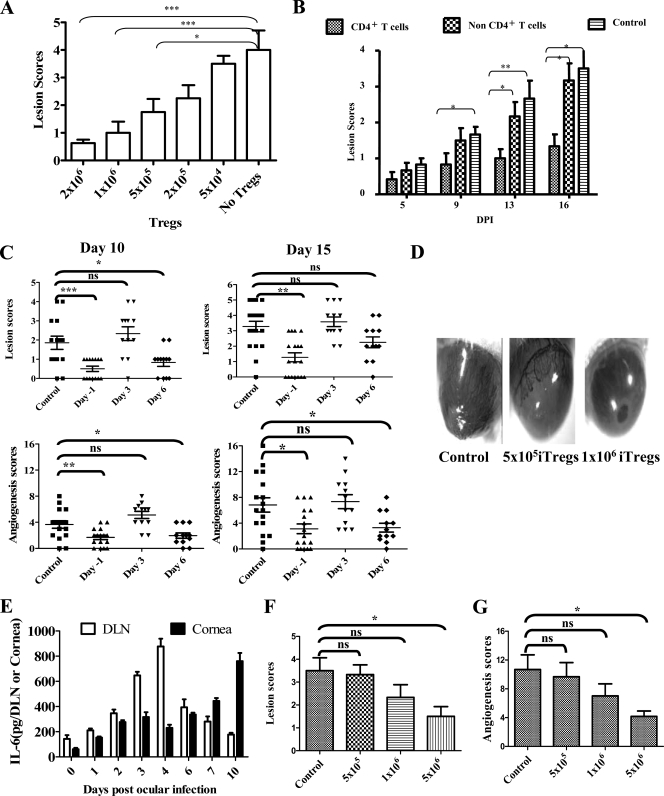
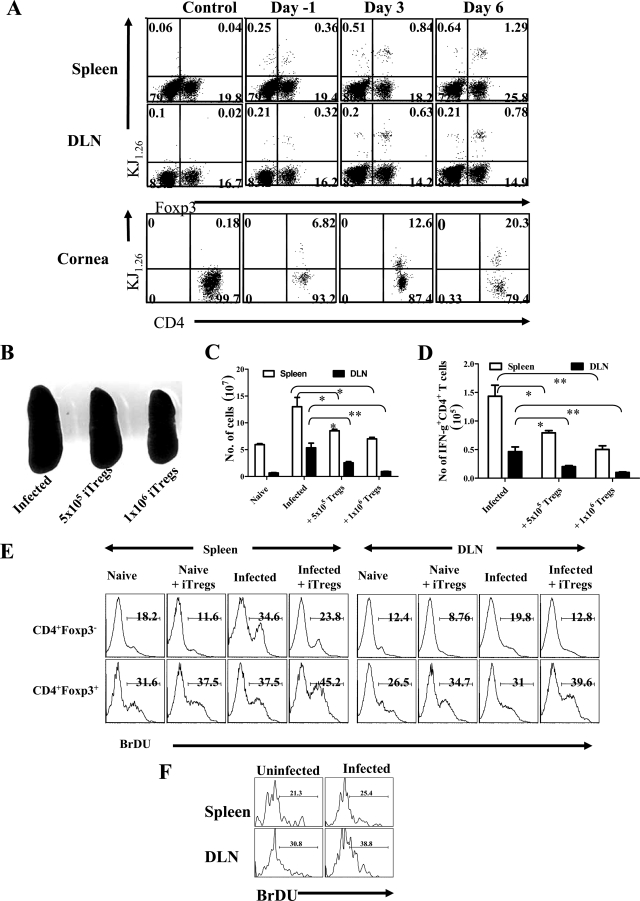
Generating and using regulatory T cells (Tregs) to modulate inflammatory disease represents a valuable approach to therapy but has not yet been applied as a means to control virus-induced immunopathological reactions. In this report, we developed a simplified technique that used unfractionated splenocytes as a precursor population and showed that stimulation under optimized conditions for 5 days with solid-phase anti-CD3 monoclonal antibody in the presence of transforming growth factor beta (TGF-beta) and interleukin-2 could induce up to 90% of CD4(+) T cells to become Foxp3(+) and able to mediate suppression in vitro. CD11c(+) dendritic cells were intricately involved in the conversion process and, once modified in the presence of TGF-beta, could convert Foxp3(-) CD4(+) cells into Foxp3(+) CD4(+)cells by producing TGF-beta. The converted cells had undergone cell division, and the majority of them expressed activation markers along with surface molecules that would facilitate their migration into tissue sites. The primary reason for our study was to determine if such in vitro-converted Tregs could be used in vivo to influence the outcome of a virus-induced immunoinflammatory lesion in the eye caused by herpes simplex virus infection. We could show in three separate models of herpetic stromal keratitis that adoptive transfers of in vitro-converted Tregs effectively diminished lesion severity, especially when given in the initial phases of infection. The suppression effect in vivo appeared to be polyspecific. The protocol we have developed could provide a useful additional approach to control virus-induced inflammatory disease.


Figures

FIG. 1.
FIG. 1.
In vitro generation of Foxp3+ CD4+ T cells from OVA-specific precursor Foxp3 CD4+ T cells. (A) Splenocytes from DO11.10 RAG2−/− mice were cultured in the presence of 0.3 μg/ml of anti-CD3 antibody, 25 U of recombinant IL-2, and the indicated concentrations of TGF-β. More than 99% of CD4+ T cells were KJ1.26 positive (gated on CD4+ T cells). After 5 days of culture, cells were analyzed for the expression of CD4 and Foxp3. Under these conditions, approximately 75% of CD4+ T cells became Foxp3+. (B) A dose-response curve for Foxp3 induction with various concentrations of anti-CD3 antibody, 10 ng/ml of TGF-β, and 25 U of IL-2 is shown. A dose of 0.125 μg/ml of anti-CD3 antibody (plate bound) was found to be optimal. (C) A dose-response histogram for Foxp3 induction with various concentrations of TGF-β, 25 U of IL-2, and 0.125 μg/ml of anti-CD3 is shown. At a dose of 10 ng/ml of TGF-β, 80 to 90% of CD4+ T cells converted to become Foxp3+. (D) Representative histograms for gated CD4+ T cells are shown to show the Foxp3 induction under optimal conditions (0.125 μg/ml of plate-bound anti-CD3 antibody, 25 U of IL-2, 10 ng/ml of TGF-β). (E) SPCs from DO11.10 RAG2−/− animals were CFSE labeled and cultured with plate-bound anti-CD3, IL-2, and TGF-β for 5 days. After 5 days, cells were stained with CD4 and Foxp3. CFSE dilution and Foxp3 expression were shown in gated CD4+ T cells. TGF-β induced CD4+ CD25+ Foxp3+ T cells to proliferate extensively.
FIG. 2.
FIG. 2.
Phenotypic characterization of in vitro-generated Foxp3+ T cells. (A) Representative FACS plots out of three similar experiments are shown for the kinetic analysis of Foxp3 induction in CD4+ CD25 Foxp3 T cells in in vitro cultures. Maximum conversion was observed at day 5 after initiation of culture (gated on CD4+ T cells). (B) Expression of surface markers on in vitro-converted Foxp3+ cells was compared with that of nTregs isolated from spleens of naïve immunocompetent animals. Representative histograms are shown. CD4+ Foxp3+ T cells were gated: dotted lines represent the isotype control, solid lines represent expression on nTregs, and solid boldface lines represent expression on iTregs. (C) A bar diagram of percentages of Foxp3+ nTregs and iTregs positive for various surface markers is shown.
FIG. 3.
FIG. 3.
Splenic CD11c+ DCs are intricately involved in causing conversion of Foxp3 T cells into Foxp3+ CD4+ T cells. The kinetics of CD103 expression on CD4+ Foxp3+ T cells (A) and CD11c+ DCs (B) in an in vitro conversion culture is shown. The expression of CD103 was observed earlier on DCs than on CD4+ Foxp3+ T cells. (C) CD11c+ DCs were purified from 48-h SPC cultures in the presence of anti-CD3, IL-2, and either without TGF-β as used in panel C(a) or with TGF-β as used in panels C(b) and C(d) or with TGF-β plus anti-TGF-β as used in panel C(c). These DCs were then cocultured in 1:5 ratios with anti-CD3-stimulated purified CD4+ CD25 Foxp3 T cells isolated from naïve DO11.10 RAG2−/− animals in the presence of IL-2 alone or with anti-TGF-β antibody. Shown is a representative FACS plot illustrating Foxp3 induction when the DCs were isolated from primary culture with no TGF-β [C(a), primary culture in presence of TGF-β [C(b)], or primary cultures in presence of TGF-β and anti-TGF-β and when DCs were from primary culture with TGF-β but anti-TGF-β antibody was added in secondary cultures.
FIG. 4.
FIG. 4.
In vitro-generated Tregs inhibit the proliferation of antigen-specific and polyspecific CD4+ CD25 T cells. CD25+ CD4+ T cells were isolated from both cultures stimulated with the conversion medium (Tregs) as well as cultures that were stimulated in the presence of IL-2 only (“control cells”). Additionally, CD4+ CD25+ T cells were also isolated from pooled spleens and LNs of BALB/c animals. These cells, in twofold serial dilutions, were used in suppression assays against the cultures of anti-CD3 antibody-stimulated CFSE-labeled CD4+ CD25 T cells (1 × 10⁵) from naïve DO11.10 RAG2−/− mice (i.e., to measure antigen-specific effect) and Thy1.1 BALB/c animals (i.e., to measure polyspecific effect) with irradiated T-cell-depleted SPCs (2 × 10⁵) from a homologous system as described in Materials and Methods. (A) The extent of CFSE dilution as an indication of suppressive activity of in vitro-generated CD4+ CD25+ regulatory T cells against anti-CD3-stimulated labeled CD4+ CD25 T cells from naïve DO.11.10 RAG2−/− animals is shown. Of the CD4+ CD25+ T cells, about 90% and 3% were Foxp3+ from cultures in the presence or absence of TGF-β, respectively. A first gate was applied on CD4+ T cells, and then the extent of CFSE dilution in CD4+ CFSE+ T cells was analyzed. (B) Blocking antibodies (Ab) to either TGF-β (10 μg/ml) or IL-10 (10 μg/ml) or PD-1 (10 μg/ml) or ICOS (10 μg/ml) were added to the suppression cultures, and the extent of division of CFSE in labeled cells was determined. Representative FACS plots at two dilutions of Tregs to T effectors are shown for PD-1- and ICOS-neutralized cultures. A dashed line represents dilution of CFSE when no Tregs were added, a solid line represents dilution of CFSE when Tregs were added, and a solid boldface line represents dilution of CFSE when, along with Tregs, either anti-PD1 or anti-ICOS antibodies were added. (C) Representative histograms indicating CFSE dilution in the Thy1.1 gated population is shown. CD4+ CD25+ T cells were isolated from the iTreg culture, control cells, and splenic nTregs from BALB/c animals and were used against anti-CD3-stimulated labeled CD4+ CD25 T cells from Thy1.1 animals. The markers show the percentages of cells that underwent less than two divisions.
FIG. 5.
FIG. 5.
In vitro-generated OVA Tregs control SK severity in a bystander disease model. Foxp3+ CD4+ T cells (5 × 10⁵) were adoptively transferred to DO11.10 RAG2−/− animals 24 h before or 6 days postocular HSV-1 infection. The disease severity and angiogenesis were recorded. (A) Gross eye pictures of control and transfer recipient animals from a representative experiment when 5 × 10⁵ Foxp3+ cells were transferred 24 h before infection are shown. (B) Cumulative data on SK severity and angiogenesis from different experiments at 11 days p.i. are shown. Foxp3+ T cells (5 × 10⁵) were transferred 24 h before or 6 days p.i. P values were calculated with one-way ANOVA using Dunnett's post-test settings. (C) Distribution of adoptively transferred Foxp3+ T cells in lymphoid organs (spleen and draining cervical LN) and ocular tissues at 11 days p.i. is shown. (D) Representative FACS plots demonstrating the infiltration of neutrophils (CD11b+ Gr1+) in collagenase-digested cornea from control and transfer recipient animals given 5 × 10⁵ Foxp3+ cells transferred 24 h before infection are shown. Absolute numbers of neutrophils/cornea are shown in parentheses.
FIG. 6.
FIG. 6.
Cotransfer of in vitro-generated Tregs with polyspecific CD4+ CD25 T cells in SCID animals reduces the severity of SK. CD4+ CD25+ T cells (1 × 10⁶) isolated from in vitro cultures and splenic nTregs (CD4+ CD25+ T cells) from naïve BALB/c animals were cotransferred with 5 × 10⁶ CD4+ CD25 T cells 24 h before ocular HSV-1 infection (5 × 10⁵ PFU). The disease severity and angiogenesis were recorded over a 12-day period. (A) The SK lesion scores and angiogenesis at 12 days p.i. are shown. (B) Proliferation of polyspecific CFSE-labeled CD4+ CD25 T cells in spleen and DLN in the presence of iTregs or splenic nTregs is shown.
FIG. 7.
FIG. 7.
In vitro-generated OVA-specific Tregs diminish the severity of SK in immunocompetent BALB/c transfer recipients in a dose-dependent manner. (A) Indicated doses of unfractionated Foxp3+ T cells were adoptively transferred in BALB/c animals 24 h before ocular HSV infection, and the disease severity was monitored until day 15. A bar diagram indicating the average SK lesion scores at different doses of transferred Foxp3+ cells at 15 days p.i. is shown. P values were calculated with one-way ANOVA using Dunnett's post-test settings, taking no Tregs as a control. (B) Fractionated CD4+ and non-CD4+ cells (5 × 10⁵) isolated from in vitro conversion cultures were transferred in BALB/c animals. Average lesion scores are shown at 15 days p.i. Only CD4+ T cells could control the severity of SK. Student's t test (unpaired) was used to calculate the level of significance. (C) Foxp3+ cells (5 × 10⁵) were transferred 24 h before or 3 days or 6 days p.i., and SK severity was recorded. Lesion scores and angiogenesis are shown at 10 days p.i. and 15 days p.i. No SK modulatory activity was shown by Tregs at 3 days p.i. transfer. P values were calculated with one-way ANOVA using Dunnett's post-test settings. (D) Eye pictures of control and iTreg transfer recipient animals from a representative experiment when 5 × 10⁵ and 1 × 10⁶ Foxp3+ cells were transferred 24 h before infection are shown. (E) The kinetics of the levels of proinflammatory cytokine IL-6 in cornea and DLN after ocular HSV-1 infection as determined by sandwich enzyme-linked immunosorbent assay is shown. (F and G) Indicated doses of iTregs were transferred at 3 days p.i. in BALB/c animals, and lesion severity (F) and angiogenesis (F) were recorded at day 15 and compared by one-way ANOVA using Dunnett's post-test settings.
FIG. 8.
FIG. 8.
Adoptively transferred Foxp3+ KJ1.26+ T cells were present in lymphoid and ocular tissues as well as diminished HSV-specific CD4+ T-cell immune response. BALB/c animals were given 5 × 10⁵ iTregs before 24 h of ocular HSV infection or 3 or 6 days p.i., and 15 days p.i., DLNs, spleens, and ocular tissues were examined for the presence of CD+ Foxp3+ and KJ+ T cells. (A) Representative FACS plots are shown. (B to D) BALB/c animals were given the indicated numbers of iTregs before 24 h of ocular HSV infection, and 15 days p.i., immune parameters were studied. (B) Spleen size as an indication of generated immune response is shown in control and iTreg recipient animals. (C) Total cellularity in the spleen (blank bars) and DLN (filled bars) of controls and Treg recipient animals is shown. (D) Total numbers of IFN-γ+ CD4+ T cells in spleen and LN of control and Treg recipients are shown. (E and F) iTregs (5 × 10⁵) were transferred into 12 animals that were then divided into four groups: naive, naïve plus iTregs, infected, and infected plus iTregs. Animals in the groups naïve plus iTregs and infected plus iTregs were given 5 × 10⁵ iTregs. After 24 h, animals from the groups infected and infected plus iTregs were infected with HSV-1. All animals were given BrdU in drinking water for the next 10 days. After 10 days, spleens and cervical DLNs were analyzed for the frequencies of host CD4+ Foxp3+ or CD4+ Foxp3 and donor CD4+ KJ1.26+ Foxp3+ cells that incorporated BrdU. Representative FACS plots for host cells (E) and donor cells (F) are shown.

Similar articles

Cited by

References

    1. Annacker, O., J. L. Coombes, V. Malmstrom, H. H. Uhlig, T. Bourne, B. Johansson-Lindbom, W. W. Agace, C. M. Parker, and F. Powrie. 2005. Essential role for CD103 in the T cell-mediated regulation of experimental colitis. J. Exp. Med. 2021051-1061. - PMC - PubMed
    1. Battaglia, M., A. Stabilini, B. Migliavacca, J. Horejs-Hoeck, T. Kaupper, and M. G. Roncarolo. 2006. Rapamycin promotes expansion of functional CD4+CD25+FOXP3+ regulatory T cells of both healthy subjects and type 1 diabetic patients. J. Immunol. 1778338-8347. - PubMed
    1. Benson, M. J., K. Pino-Lagos, M. Rosemblatt, and R. J. Noelle. 2007. All-trans retinoic acid mediates enhanced T reg cell growth, differentiation, and gut homing in the face of high levels of co-stimulation. J. Exp. Med. 2041765-1774. - PMC - PubMed
    1. Bettelli, E., Y. Carrier, W. Gao, T. Korn, T. B. Strom, M. Oukka, H. L. Weiner, and V. K. Kuchroo. 2006. Reciprocal developmental pathways for the generation of pathogenic effector TH17 and regulatory T cells. Nature 441235-238. - PubMed
    1. Cao, O., E. Dobrzynski, L. Wang, S. Nayak, B. Mingle, C. Terhorst, and R. W. Herzog. 2007. Induction and role of regulatory CD4+CD25+ T cells in tolerance to the transgene product following hepatic in vivo gene transfer. Blood 1101132-1140. - PMC - PubMed

Publication types

MeSH terms

Substances