Regulation of autophagy by cytoplasmic p53

Ezgi Tasdemir et al. Nat Cell Biol. 2008 Jun.

Abstract

Multiple cellular stressors, including activation of the tumour suppressor p53, can stimulate autophagy. Here we show that deletion, depletion or inhibition of p53 can induce autophagy in human, mouse and nematode cells subjected to knockout, knockdown or pharmacological inhibition of p53. Enhanced autophagy improved the survival of p53-deficient cancer cells under conditions of hypoxia and nutrient depletion, allowing them to maintain high ATP levels. Inhibition of p53 led to autophagy in enucleated cells, and cytoplasmic, not nuclear, p53 was able to repress the enhanced autophagy of p53(-/-) cells. Many different inducers of autophagy (for example, starvation, rapamycin and toxins affecting the endoplasmic reticulum) stimulated proteasome-mediated degradation of p53 through a pathway relying on the E3 ubiquitin ligase HDM2. Inhibition of p53 degradation prevented the activation of autophagy in several cell lines, in response to several distinct stimuli. These results provide evidence of a key signalling pathway that links autophagy to the cancer-associated dysregulation of p53.


Figures
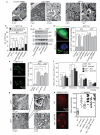
Figure 1
Figure 1
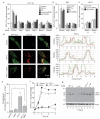
Induction of autophagic vacuolization by deletion, depletion or inhibition of p53. (a) Ultrastructural evidence of autophagy induced by depletion of p53 with a specific siRNA or pharmacological inhibition of p53 with PFT-α in HCT116 cells. (b) Autophagy induced by PFT-α, p53 knockdown, or p53 knockout in HCT116 cells. The number of autophagosomes and autolysosomes was determined for at least 50 cells in 3 independent experiments (mean ± s.e.m.; *P < 0.05). Culture in nutrient-free (NF) conditions was used as a positive control. (c) Effect of p53 on the maturation of LC3. Immunoblots are shown for wild-type (WT) or p53-/- HCT116 (n = 3). (d) GFP-LC3 puncta induced by PFT-α, p53 knockdown or knockout. WT and p53-/- HCT116 cells were transfected with control or p53-specific siRNAs, re-transfected with a GFP-LC3 plasmid, cultured in complete medium for 24 h and kept for 6 h in the presence or absence of 30 µM PFT-α. The percentage of cells showing accumulation of GFP-LC3 in puncta (GFP-LC3vac) is reported (mean ± s.d., n = 3; *P < 0.05). (e) GFP-LC3 puncta in p53-/- MEF, compared with WT MEF transfected with GFP-LC3 (mean ± s.d., n = 3; *P < 0.05). (f) GFP-LC3 dots in tissues from p53+/+ or p53-/- mice expressing a GFP-LC3 transgene (mean ± s.d.; *P < 0.05), without or after 24 h of starvation. The number of GFP-LC3 dots per area was determined for a minimum of 4 fields (at ×400 magnification for 4 slides per animal, 3 animals per condition). (g) TEM pictures of p53-/- and p53+/- mouse livers. p53-/- hepatocytes carry approximately 3 autophagosomes, p53+/- controls approximately 1 per cell. (h) Modulation of DsRed::LGG-1 levels by the p53 orthologue CEP-1 in C. elegans. Representative pictures are shown for WT animals and for nematodes carrying a cep-1 deletion allele (gk138). The count of puncta per cell was 6.9 ± 3.3 for WT, 52.2 ± 9.4 for cep-1 (gk138) embryos (mean ± s.e.m. for 20 individuals, 5 cells per embryo). The quantification of DsRed::LGG-1 puncta is shown for the indicated genetic backgrounds and conditions (dots represent pixel intensity for individual embryos).
Figure 2
Figure 2
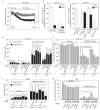
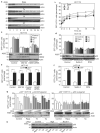
PFT-α triggers autophagic vacuolization and has no effect on vacuole-lysosome fusion. (a) PFT-α or p53 siRNA-induced GFP-LC3 puncta in WT HCT116 cells transfected with siRNAs to deplete the essential autophagy gene products Atg5, Atg10, Atg12, Beclin 1 or hVps34. Culture in nutrient-free (NF) conditions was used as a control of autophagy induction. (b) PFT-α or p53 siRNA-mediated GFP-LC3 puncta in MEFs transfected with siRNAs specific for mouse Atg5 or Beclin 1. (c) Requirement of Beclin 1 expression for autophagy induction by p53 depletion in MCF7 cells. MCF7 cells stably transfected with a tetracyclinerepressible Beclin 1 construct were maintained in conditions that prevent or allow Beclin 1 expression, transfected with GFP-LC3 and subjected to p53 knockdown before quantification of GFP-LC3 puncta. Data in a-c are mean ± s.d. of 3 independent experiments. (d-f) Effect of bafilomycin A1 (BafA1) on PFT-α-induced GFP-LC3 puncta. GFP-LC3-expressing HeLa cells were treated with PFT-α and/or BafA1 and then immunostained for Lamp-2 to observe the colocalization between GFP-LC3 and Lamp-2. Representative confocal microphotographs are shown together with the profiles of colocalization (d) within the area of interest, indicated by the orientation of the arrow. Percentage overlap was plotted for control cells and cells cultured in the presence of PFT-α and/or BafA1 after 6 h (d, e). Columns represent the percentage of colocalization of GFP-LC3 and Lamp-2 (mean ± s.d.; *P < 0.05), quantified for at least 50 cells for each condition. The kinetics of GFP-LC3 redistribution was quantified by conventional fluorescence microscopy (mean ± s.d., 3 experiments, f). (g) Immunoblot detection of LC3-I/II in cells treated with PFT-α and/or leupeptin in WT HCT116 cells (n = 3).
Figure 3
Figure 3
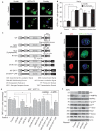
Role of AMPK, p70S6K and mTOR in the p53-mediated modulation of autophagy. (a) Immunoblot detection of the phosphorylation status of AMPKα, ACCα, TSC2 and p70S6K in HCT116 cells. Hypophosphorylation of p70S6K and hyperphosphorylation of AMPKα, ACCα and TSC2 was detected in p53-/- HCT116, compared with WT HCT116 cells after culture in complete medium (n = 5). (b) Quantification of GFP-LC3vac cells in WT and p53-/- HCT116 cells transfected with siRNAs specific for the catalytic α1 and α2 subunits of AMPK (mean ± s.d. of 3 independent experiments; *P < 0.05). The inset in b demonstrates the efficiency of siRNA-mediated downregulation of AMPKα1 and AMPKα2, as assessed by immunoblot analysis (n = 3). Note that the antibody recognizes both AMPKα1 and AMPKα2. (c) Immunoblot detection of ACCα phosphorylation in WT and p53-/- HCT116 cells subjected to knockdown of AMPKα1 and AMPKα2 (n = 5); Co, control. (d) Quantification of GFP-LC3vac cells (means ± s.d., n = 3 separate experiments) in WT HCT116 and p53-/- HCT116 treated with PFT-α and/or rapamycin.
Figure 4
Figure 4
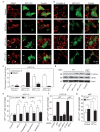
p53 deletion attenuates ATP depletion during glucose deprivation and favours survival under metabolic stress. (a) Cytosolic ATP levels in WT and p53-/- HCT116 cells in the absence of glucose. Measurements were performed on luciferase-expressing HCT116, after perfusion of the cells with medium first containing then missing glucose. (b) Effect of methylpyruvate (MetPyr) on ATP levels in WT p53-/- HCT116 cells depleted of glucose. ATP levels were measured as in a, in the presence of glucose and 15 min after its withdrawal or replacement by MetPyr. (c) Effect of autophagy on the ATP levels of WT and p53-/- HCT116 cells depleted of glucose. Cells were transfected with siRNAs specific for Beclin 1 and AMPKα, or they were treated with rapamycin for 6 h, followed by measurement of ATP levels as in a, before or after glucose withdrawal (means ± s.d. of triplicates, 3 independent experiments). (d) Metabolic stress-induced cell death is attenuated in the absence of p53. HCT116 cells were transfected with control, Atg5-, Atg10-, or AMPKα-specific siRNAs and were subjected 48 h later to metabolic stress (cultured for 48 h in nutrient-free, hypoxic conditions) and stained with DiOC6(3) and PI. The black and white portions of the columns refer to the DiOC6(3)low PI- (dying) and DiOC6(3)low PI+(dead) population, respectively. (e) Metabolic stress-induced decrease of clonogenic survival was attenuated in the absence of p53. HCT116 cells subjected to metabolic stress as in d were monitored for clonogenic survival. (f) Expression of Beclin 1 in MCF7 cells restores the survival advantage conferred by p53 depletion. MCF7 cells that carry a tetracycline-repressible Beclin 1 expression construct were cultured to avoid Beclin 1 expression or to induce it, transfected with a control siRNA or a p53-specific siRNA, subjected to metabolic stress, and finally stained with DiOC6(3)/PI. (g) Effect of p53 and autophagy on the survival of metabolically stressed MEFs. WT MEFs were transfected with the indicated siRNAs and then subjected to metabolic stress before performing clonogenic assays. Results in d-g are mean ± s.d. of 3 separate experiments (*P < 0.05); Co, control.
Figure 5
Figure 5
Inhibition of autophagy by cytoplasmic p53. (a, b) PFT-α-mediated stimulation of autophagy in cytoplasts. GFP-LC3-transfected HeLa cells were enucleated by density-gradient centrifugation after cytochalasin B treatment and cultured on polylysine-coated coverslips. Mixtures of cells and cytoplasts (arrows, identified by the lack of Hoechst 33342 staining) were then exposed to three different autophagy inducers: PFT-α, nutrient starvation and rapamycin. Results are means ± s.d. n = 3 experiments). (c-e) Effect of p53 mutants on autophagy in p53-/-HCT116 cells. The p53 domains and mutants used in this study are schematically represented in c. Representative micrographs of cells transfected with plasmids expressing WT, nuclear and cytoplasmic p53 are shown in d. Quantification of GFP-LC3 puncta of p53-/- HCT116 cells transiently transfected with p53 mutants is shown in e (mean ± s.d., n = 3 experiments, *P < 0.05). (f) Detection of the phosphorylation status of AMPKα, AACα, TSC2 and p70S6K in p53-/- HCT116 cells transiently expressing WT or mutant p53 (n = 5).
Figure 6
Figure 6
p53 inhibition induces autophagy by ER stress (a-c) WT HCT116 cells were transiently transfected with GFP-LC3, treated with PFT-α for 2, 4 or 6 h and subjected to immunofluorescence staining to observe the colocalization of GFP-LC3+ puncta with the ER marker ERp57 (a) or a mitochondrial marker (b). Note that cells with GFP-LC3+ puncta often contain scarce amounts of ERp57 (white arrows) after prolonged incubation with PFT-α. The percentage of colocalization (means ± s.d., n = 3 experiments with 50 images per experiment) was determined by confocal microscopy (c). (d) eIF2α phosphorylation in WT or p53-/- HCT116 cells treated with PFT-α (n = 5). (e, f) WT HCT116 cells (e, f) or p53-/- HCT116 cells (f) were transfected with GFP-LC3, plus a control siRNA or the indicated combination of IRE1α- and/or p53-specific siRNA, and treated with PFT-α, thapsigargin, tunicamycin or brefeldin A. (g) GFP-LC3-transfected WT or ire1α-/- MEF were treated with PFT-α. Columns in e-g show means ± s.d. of 3 independent experiments (*P < 0.05).
Figure 7
Figure 7
Induction of autophagy requires p53 degradation mediated by HDM2 and the proteasome. Kinetics of p53 degradation (a) and induction of GFP-LC3 puncta (b) in WT HCT116 cells cultured in complete medium in the presence of rapamycin (Rapa), tunicamycin (Tn), lithium (Li) or in nutrient-free medium (NF). (c) WT HCT116 cells transfected with control or HDM2-targeted siRNAs were cultured in the presence or absence of MG132 for 3 h, followed by the treatment with autophagy inducers for 6 h (Tp, thapsigargin; other abbreviations as in b). The abundance of p53 and HDM2 was determined by immunoblotting analysis and the percentage of cells showing accumulation of GFP-LC3 in vacuoles (GFP-LC3vac) was determined. (d) Effects of HDM2 inhibitors on p53 protein levels and autophagy. WT HCT116 were left untreated or treated with Nutlin-3, RITA and/or the indicated autophagy inducers, followed by the p53 immunoblot or immunofluorescence microscopy to visualize GFP-LC3 redistribution. (e) Effect of MG132 and HDM2 siRNA on autophagy of WT and p53-/- HCT116 cells. (f) Failure of HDM2 inhibitors to prevent autophagy induced by the absence of p53. Nutlin-3 and RITA were added to p53-/- HCT116 cells, followed by quantification of GFP-LC3 puncta. (g) Effect of WT and ubiquitination-resistant p53 on autophagy. p53-/- HCT116 cells were transfected with GFP-LC3 alone or in combination with different concentrations of pcDNA3.1, WT p53 or p53 lacking the ubiquitination site at amino acids 13-19 (p53ΔI), then treated with rapamycin, tunicamycin or thapsigargin. Thereafter, p53 expression and GFP-LC3 puncta were quantified. (h) Depletion of Atg5 or Beclin 1 does not prevent p53 degradation triggered by rapamycin or ER stressors. In WT HCT116 cells transfected with siRNA targeting Atg5 or Beclin 1, p53 levels were determined by immunoblot analysis after 6 h of treatment with rapamycin, tunicamycin or thapsigargin. Quantification of GFP- LC3vac cells in b-g are mean ± s.d. of 3 separate experiments, *P < 0.05. The blots in a, c, d, g and h shown are representative of 3-5 different experiments.

Similar articles

Cited by

References

    1. Levine B, Kroemer G. Autophagy in the pathogenesis of disease. Cell. 2008;132:27–42. - PMC - PubMed
    1. Levine B, Yuan J. Autophagy in cell death: an innocent convict? J. Clin. Invest. 2005;115:2679–2688. - PMC - PubMed
    1. Degenhardt K, et al. Autophagy promotes tumor cell survival and restricts necrosis, inflammation, and tumorigenesis. Cancer Cell. 2006;10:51–64. - PMC - PubMed
    1. Qu X, et al. Autophagy gene-dependent clearance of apoptotic cells during embryonic development. Cell. 2007;128:931–946. - PubMed
    1. Matthew R, Karantza-Wadsworth V, White E. Role of autophagy in cancer. Nature Rev. Cancer. 2007;7:961–967. - PMC - PubMed

Publication types

Substances