. 2008 Apr 30;28(18):4807-17.
doi: 10.1523/JNEUROSCI.4667-07.2008.

Vision triggers an experience-dependent sensitive period at the retinogeniculate synapse

Affiliations

Vision triggers an experience-dependent sensitive period at the retinogeniculate synapse

Bryan M Hooks et al. J Neurosci. .

Abstract

In the mammalian visual system, sensory experience is widely thought to sculpt cortical circuits during a precise critical period. In contrast, subcortical regions, such as the thalamus, were thought to develop at earlier ages in a vision-independent manner. Recent studies at the retinogeniculate synapse, however, have demonstrated an influence of vision on the formation of synaptic circuits in the thalamus. In mice, dark rearing from birth does not alter normal developmental maturation of the connection between retina and thalamus. However, deprivation 20 d after birth [postnatal day 20 (p20)] resulted in dramatic weakening of synaptic strength and an increase in the number of retinal inputs that innervate a thalamic relay neuron. Here, by quantifying changes in synaptic strength and connectivity in response to different time windows of deprivation, we find that several days of vision after eye opening is necessary for triggering experience-dependent plasticity. Shorter periods of visual experience do not permit similar experience-dependent synaptic reorganization. Furthermore, changes in connectivity are rapidly reversible simply by restoring normal vision. However, similar plasticity did not occur when shifting the onset of deprivation to p25. Although synapses still weakened, recruitment of additional retinal inputs no longer occurred. Therefore, synaptic circuits in the visual thalamus are unexpectedly malleable during a late developmental period, after the time when normal synapse elimination and pruning has occurred. This thalamic sensitive period overlaps temporally with experience-dependent changes in the cortex, suggesting that subcortical plasticity may influence cortical responses to sensory experience.


Figures
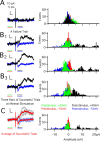
Figure 1.
Figure 1.
Single-fiber amplitude determination. A, Left, Raw traces of a pair of failure trials at +40 mV (black) and −70 mV (blue). Calibration: 10 pA, 5 ms. Color lines underneath recordings indicate 10 ms time window over which data were used to compute amplitude histograms in 0.1 pA bins (sampling interval, 20 μs). Right, Histograms of recordings at −70 mV (inward current) and +40 mV (outward current). Red (−70 mV) and green (+40 mV) bars are from before stimulation; blue (−70 mV) and black (+40 mV) bars are after stimulation. Substantial overlap occurs for failure trials and is centered around 0 pA with ±5 pA of noise. B, C, Examples of three raw traces of successful trials (B1–B3) and average of all successful trials (C) interleaved at −70 mV (blue) and +40 mV (black). Calibration is the same as in A. All trials in B and C were at the same stimulus intensity. In C, traces averaged together are overlaid, with the average trace in red and raw traces in blue and black. Presentation of histograms is as in A. Note shift of distribution away from 0 pA for successful trials.
Figure 2.
Figure 2.
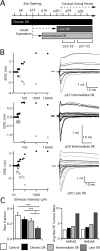
Sensitivity to visual deprivation peaks after a week of visual experience at the retinogeniculate synapse. A, Timeline of mouse visual development, annotated with time of eye opening and variation in the amount of visual experience (dotted arrow) or deprivation (black or gray blocks) before evaluation of retinogeniculate synaptic connectivity. The conditions chronic DR (deprivation from p1+), late DR (deprivation from p20+), and intermediate DR (deprivation from p15+) are compared. Ages at which animals were evaluated indicated below the condition. B, Recordings from activity-manipulated animals. Top, LGN cell from p22 intermediate DR mouse. Top left, Graph of peak EPSC for AMPAR (−70 mV; white circles) and NMDAR (+40 mV; black circles) plotted against stimulus intensity. Top right, Superimposed traces of EPSCs recorded while increasing stimulus intensity. Middle, LGN cell from p30 intermediate DR animal. Bottom, Neuron from p30 late DR mouse. C, Estimated connectivity. Left, Fiber fraction is computed as the average of the ratio of each single-fiber input divided by the maximal current for the same cell, as described previously by Hooks and Chen (2006). Significant differences exist between late DR and all other conditions. Right, Ratio of average maximal current to average single-fiber (SF) current for AMPAR and NMDAR. Control: p22–p26, 33 cells from 11 animals; p27–p32, 39 from 13. Chronic DR: p22–p26, 37 from 11; p27–p32, 32 from 13. Intermediate DR: p22–p26, 33 from 10; p27–p32, 41 from 15. Late DR: p27–p32, 63 from 21. *p < 0.05; ***p < 0.001.
Figure 3.
Figure 3.
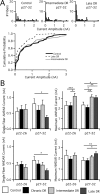
A week of visual experience before deprivation maximizes plasticity at the retinogeniculate synapse. A, Top, Analysis of single-fiber AMPAR currents for mature control and deprived mice. Single-fiber AMPAR currents are measured at −70 mV after manipulations of visual experience. Histograms are divided into bins of 50 pA. Note the large number of weak fibers (<100 pA) in all conditions, especially pronounced in late DR, and non-normal distribution. n = 48, 45, and 64 for control, intermediate DR, and late DR, respectively. Bottom, Cumulative probability plots for the same. B, Synaptic current after manipulations of visual experience is measured at −70 mV (AMPAR) and +40 mV (NMDAR, slow component). The peak current amplitude in response to activation of a single retinal afferent is measured as single-fiber current, and maximal current is measured after excitation of the entire optic tract. Average single-fiber (left) and maximal current (right; note changes in scale) amplitude for AMPAR (top) and NMDAR (bottom) currents assessed in control mice, chronic DR, intermediate DR, and late DR, with ages tested noted below. Control: p22–p26, 33 cells from 11 animals; p27–p32, 35 from 13. Chronic DR: p22–p26, 37 from 11; p27–p32, 39 from 13. Intermediate DR: p22–p26, 33 from 10; p27–p32, 41 from 15. Late DR: p27–p32, 63 from 21. *p < 0.05; **p < 0.01; ***p < 0.001.
Figure 4.
Figure 4.
Reorganization of synaptic connectivity requires more than 4 d of deprivation. A, Experimental paradigm showing visual experience and deprivation after dark rearing at p20. Animals evaluated at p23–p24 (short DR) are compared with those at p27–p32 (late DR), where time after deprivation is the only variable. B, Recordings from visually deprived animals: p24 short DR (top) and p29 late DR (bottom), presented as in Figure 2. C, Rearrangements in retinal ganglion cell innervation of LGN relay cells occurs after visual deprivation, but such changes take longer than 4 d to occur. Changes are quantified by both the fiber fraction method (left) and the ratio method (right). Statistical test results are shown for fiber fraction. SF, Single fiber. Control: p27–p32, 39 cells from 13 animals. Late DR: p27–p32, 63 from 21. Short DR: p23–p24, 35 from 15. **p < 0.01; ***p < 0.001.
Figure 5.
Figure 5.
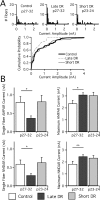
Weakening of retinogeniculate synapses requires more than 4 d of deprivation. A, Single-fiber AMPAR currents for control, late DR, and short DR mice presented in histograms as before. n = 48, 64, and 45 for control, late DR, and short DR. Cumulative probability plot (below) given for these three conditions. B, Bar graphs of synaptic current at −70 mV (AMPAR) and +40 mV (NMDAR, slow component). Average single-fiber (left) and maximal current (right; note changes in scale) amplitude for AMPAR (top) and NMDAR (bottom) currents was assessed in control and late DR mice at p27–p32 and in short DR mice at p23–p24. Control: p27–p32, 39 cells from 13 animals. Late DR: p27–p32, 63 from 21. Short DR: p23–p24, 35 from 15. *p < 0.05; **p < 0.01.
Figure 6.
Figure 6.
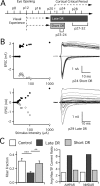
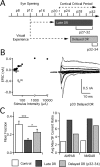
Visual deprivation at later ages does not recruit additional retinogeniculate afferents. A, Timeline of late DR and delayed DR (deprivation from p25+) experimental paradigms, with ages evaluated at bottom. B, Recording from p33 delayed DR animal: graph of peak EPSC amplitudes for all stimulus intensities (left) and traces at −70 mV and +40 mV (inward and outward current, respectively; right). C, Left, Estimated connectivity assessed by fiber fraction as described previously. Control: p27–p32, 39 cells from 13 animals. Late DR: p27–p32, 63 from 21. Delayed DR: p32–p34, 32 from 12. Significant differences are annotated as *p < 0.05 and ***p < 0.001. Right, Ratio of average maximal current to average single-fiber current for AMPAR and NMDAR. SF, Single fiber.
Figure 7.
Figure 7.
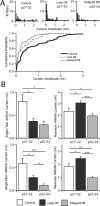
Visual deprivation at later ages results in synaptic weakening. A, Top, Analysis of single-fiber AMPAR currents at −70 mV for mature control and deprived mice. Histograms are divided into bins of 50 pA. Note that the large number of weak fibers (<100 pA) is pronounced in late DR and delayed DR. n = 48, 64, and 34 for control, late DR, and delayed DR, respectively. Bottom, Cumulative probability plots for the same. B, Synaptic current after manipulations of visual experience is measured at −70 mV (AMPAR) and +40 mV (NMDAR, slow component). Average single-fiber (left) and maximal current (right, note changes in scale) amplitude for AMPAR (top) and NMDAR (bottom) currents assessed in control mice, late DR, and delayed DR. Control: p27–p32, 39 cells from 13 animals. Late DR: p27–p32, 63 from 21. Delayed DR: p32–p34, 32 from 12. *p < 0.05; **p < 0.01; ***p < 0.001.
Figure 8.
Figure 8.
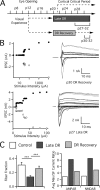
Deprivation-induced changes in retinogeniculate connectivity can be rapidly reversed by restoration of normal vision. A, Timeline showing periods of visual experience and deprivation after dark rearing at p20. Animals are evaluated at p27–p32 (late DR) or p30–p32 (DR recovery) after allowing a short period of reexposure to normal vision. B, Recordings from visually manipulated animals: p32 DR recovery (top) and p27 late DR (bottom). C, Reversal of changes in retinogeniculate connectivity in visual thalamus after restoration of normal sensory experience. Connectivity of retinogeniculate afferents is estimated by fiber fraction method (left) and ratio (right) methods. SF, Single fiber. Control: p27–p32, 39 cells from 13 animals. Late DR: p27–p32, 63 from 21. DR recovery: p30–p32, 29 from 18. ***p < 0.001.
Figure 9.
Figure 9.
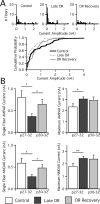
Restoration of normal vision strengthens retinogeniculate afferents. A, Top, Single-fiber AMPAR currents measured at −70 mV for mature control, late DR, and DR recovery mice are plotted as histograms in bins of 50 pA. Note changes in the number of small afferents (<100 pA), especially for late DR and DR recovery. n = 48, 64, and 30 for control, late DR, and DR recovery. A, Bottom, Cumulative probability plots comparing the same three conditions. B, Measurements of synaptic current at −70 mV (AMPAR) and +40 mV (NMDAR, slow component), noting significant changes in single-fiber AMPAR and NMDAR current amplitudes after DR recovery. Average single-fiber (left) and maximal current (right; note changes in scale) amplitude for AMPAR (top) and NMDAR (bottom) currents assessed in the oldest age groups (noted below) of control mice, late DR, and DR recovery. Control: p22–p26, 33 cells from 11 animals; p27–p32, 39 from 13. Late DR: p27–p32, 63 from 21. DR recovery: p30–p32, 29 from 18. *p < 0.05; **p < 0.01.

Similar articles

Cited by

References

    1. Akerman CJ, Smyth D, Thompson ID. Visual experience before eye-opening and the development of the retinogeniculate pathway. Neuron. 2002;36:869–879. - PubMed
    1. Alexander GM, Fisher TL, Godwin DW. Differential response dynamics of corticothalamic glutamatergic synapses in the lateral geniculate nucleus and thalamic reticular nucleus. Neuroscience. 2006;137:367–372. - PubMed
    1. Antonini A, Stryker MP. Rapid remodeling of axonal arbors in the visual cortex. Science. 1993;260:1819–1821. - PubMed
    1. Antonini A, Fagiolini M, Stryker MP. Anatomical correlates of functional plasticity in mouse visual cortex. J Neurosci. 1999;19:4388–4406. - PMC - PubMed
    1. Burrone J, O'Byrne M, Murthy VN. Multiple forms of synaptic plasticity triggered by selective suppression of activity in individual neurons. Nature. 2002;420:414–418. - PubMed

Publication types

MeSH terms

LinkOut - more resources