The global, ppGpp-mediated stringent response to amino acid starvation in Escherichia coli
- PMID: 18430135
- PMCID: PMC3719176
- DOI: 10.1111/j.1365-2958.2008.06229.x
The global, ppGpp-mediated stringent response to amino acid starvation in Escherichia coli
Abstract
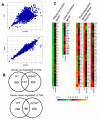
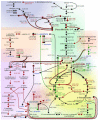
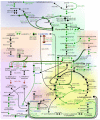
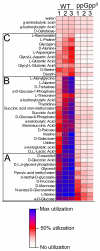
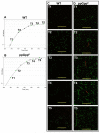
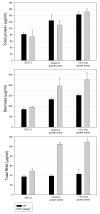
The stringent response to amino acid starvation, whereby stable RNA synthesis is curtailed in favour of transcription of amino acid biosynthetic genes, is controlled by the alarmone ppGpp. To elucidate the extent of gene expression effected by ppGpp, we designed an experimental system based on starvation for isoleucine, which could be applied to both wild-type Escherichia coli and the multiauxotrophic relA spoT mutant (ppGpp(0)). We used microarrays to profile the response to amino acid starvation in both strains. The wild-type response included induction of the general stress response, downregulation of genes involved in production of macromolecular structures and comprehensive restructuring of metabolic gene expression, but not induction of amino acid biosynthesis genes en masse. This restructuring of metabolism was confirmed using kinetic Biolog assays. These responses were profoundly altered in the ppGpp(0) strain. Furthermore, upon isoleucine starvation, the ppGpp(0) strain exhibited a larger cell size and continued growth, ultimately producing 50% more biomass than the wild-type, despite producing a similar amount of protein. This mutant phenotype correlated with aberrant gene expression in diverse processes, including DNA replication, cell division, and fatty acid and membrane biosynthesis. We present a model that expands and functionally integrates the ppGpp-mediated stringent response to include control of virtually all macromolecular synthesis and intermediary metabolism.
Figures


Similar articles
-
Rapid Curtailing of the Stringent Response by Toxin-Antitoxin Module-Encoded mRNases.J Bacteriol. 2016 Jun 27;198(14):1918-1926. doi: 10.1128/JB.00062-16. Print 2016 Jul 15. J Bacteriol. 2016. PMID: 27137501 Free PMC article.
-
The ObgE/CgtA GTPase influences the stringent response to amino acid starvation in Escherichia coli.Mol Microbiol. 2009 Jul;73(2):253-66. doi: 10.1111/j.1365-2958.2009.06767.x. Epub 2009 Jun 23. Mol Microbiol. 2009. PMID: 19555460 Free PMC article.
-
Delayed-relaxed response explained by hyperactivation of RelE.Mol Microbiol. 2004 Jul;53(2):587-97. doi: 10.1111/j.1365-2958.2004.04127.x. Mol Microbiol. 2004. PMID: 15228536
-
Control of bacterial transcription, translation and replication by (p)ppGpp.Curr Opin Microbiol. 2008 Apr;11(2):100-5. doi: 10.1016/j.mib.2008.02.001. Epub 2008 Mar 24. Curr Opin Microbiol. 2008. PMID: 18359660 Review.
-
ppGpp: a global regulator in Escherichia coli.Trends Microbiol. 2005 May;13(5):236-42. doi: 10.1016/j.tim.2005.03.008. Trends Microbiol. 2005. PMID: 15866041 Review.
Cited by
-
Bacterial persistence is an active σS stress response to metabolic flux limitation.Mol Syst Biol. 2016 Sep 21;12(9):882. doi: 10.15252/msb.20166998. Mol Syst Biol. 2016. PMID: 27655400 Free PMC article.
-
From laboratory to pilot plant E. coli fed-batch cultures: optimizing the cellular environment for protein maximization.J Ind Microbiol Biotechnol. 2013 Apr;40(3-4):335-43. doi: 10.1007/s10295-012-1226-6. Epub 2013 Jan 22. J Ind Microbiol Biotechnol. 2013. PMID: 23338174
-
Involvement of cyclic AMP receptor protein in regulation of the rmf gene encoding the ribosome modulation factor in Escherichia coli.J Bacteriol. 2013 May;195(10):2212-9. doi: 10.1128/JB.02279-12. Epub 2013 Mar 8. J Bacteriol. 2013. PMID: 23475967 Free PMC article.
-
YtfK activates the stringent response by triggering the alarmone synthetase SpoT in Escherichia coli.Nat Commun. 2019 Dec 17;10(1):5763. doi: 10.1038/s41467-019-13764-4. Nat Commun. 2019. PMID: 31848343 Free PMC article.
-
A transcriptional "Scream" early response of E. coli prey to predatory invasion by Bdellovibrio.Curr Microbiol. 2010 Jun;60(6):419-27. doi: 10.1007/s00284-009-9559-8. Epub 2009 Dec 20. Curr Microbiol. 2010. PMID: 20024656 Free PMC article.
References
-
- Aberg A, Shingler V, Balsalobre C. (p)ppGpp regulates type 1 fimbriation of Escherichia coli by modulating the expression of the site-specific recombinase FimB. Molecular microbiology. 2006;60:1520–1533. - PubMed
-
- Artsimovitch I, Patlan V, Sekine S, Vassylyeva MN, Hosaka T, Ochi K, Yokoyama S, Vassylyev DG. Structural basis for transcription regulation by alarmone ppGpp. Cell. 2004;117:299–310. - PubMed
-
- Barker MM, Gaal T, Gourse RL. Mechanism of regulation of transcription initiation by ppGpp. II. Models for positive control based on properties of RNAP mutants and competition for RNAP. Journal of molecular biology. 2001a;305:689–702. - PubMed
-
- Barker MM, Gaal T, Josaitis CA, Gourse RL. Mechanism of regulation of transcription initiation by ppGpp. I. Effects of ppGpp on transcription initiation in vivo and in vitro. Journal of molecular biology. 2001b;305:673–688. - PubMed
-
- Battesti A, Bouveret E. Acyl carrier protein/SpoT interaction, the switch linking SpoT-dependent stress response to fatty acid metabolism. Molecular microbiology. 2006;62:1048–1063. - PubMed
Publication types
MeSH terms
Substances
Grants and funding
LinkOut - more resources
Full Text Sources
Other Literature Sources
Molecular Biology Databases
Research Materials

